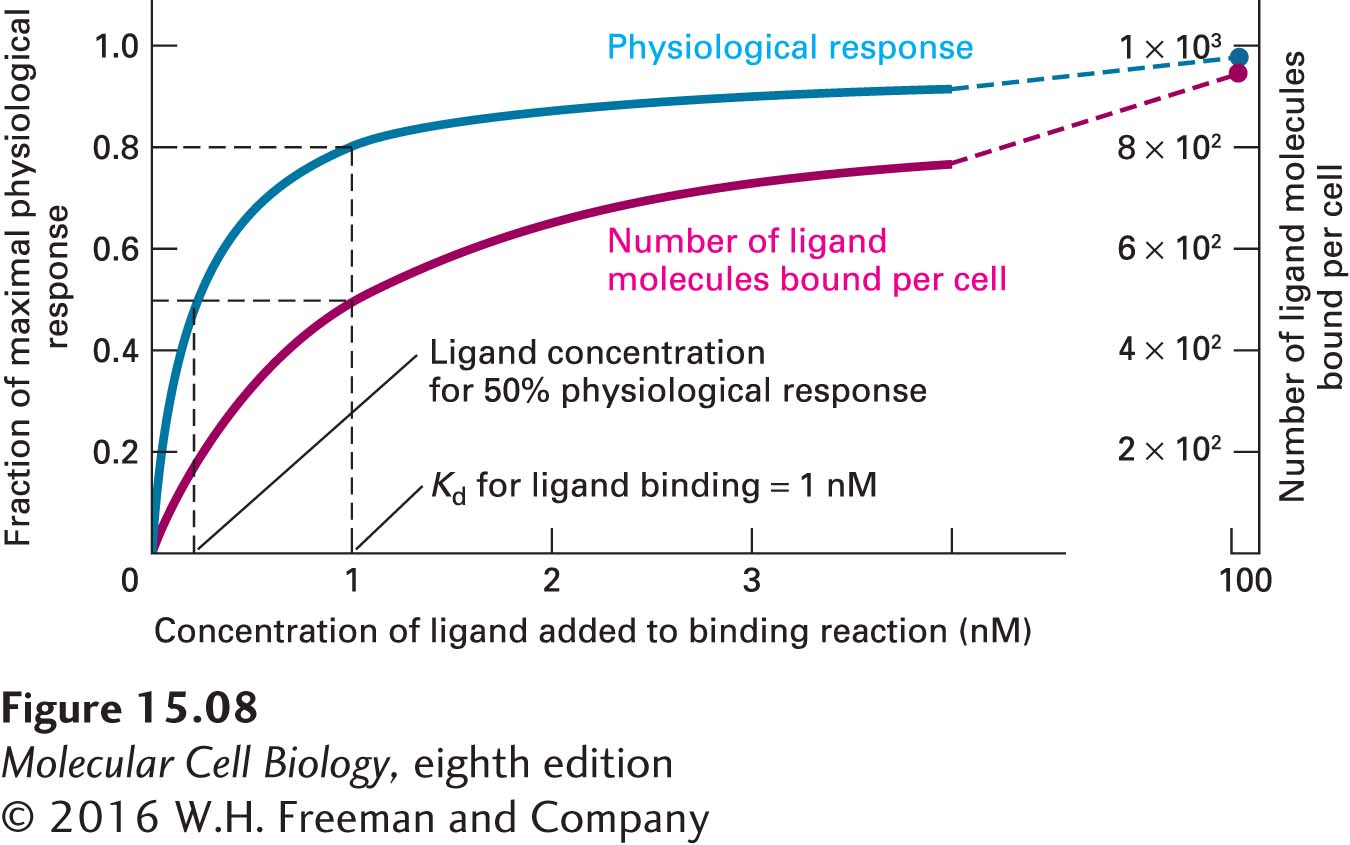
FIGURE 15- 8 Binding assays determine the Kd and the number of receptors per cell, but the maximal physiological response to an external signal usually occurs when only a fraction of the receptors are occupied by ligand. In a typical experiment to determine the affinity of a receptor for a ligand, radioactively or otherwise labeled ligand is incubated with cells that do not express the receptor of interest and with cells that have been altered by recombinant DNA techniques to express that receptor on their surface. Incubation is generally for an hour at 4 °C; the low temperature is used to prevent endocytosis of the cell- surface receptors. The cells are then separated from unbound ligand, usually by centrifugation and washing with buffer, and the amount of radioactivity bound to the cells is measured. “Background” binding by control cells is subtracted from the binding to the receptor- expressing cells, and the amount of bound ligand per cell is calculated and plotted (red curve) as a function of the ligand concentration. Note that even at relatively high ligand concentrations, the number of receptor- bound ligand molecules approaches, but does not equal, the number of cell- surface receptors. Nonetheless, by analysis of the data using equation 15- 4, one can determine that these cells express 1000 receptors for this ligand, and that the Kd for binding of the ligand is 1 nM. In parallel experiments, the physiological response of the cell to increasing concentrations of ligand is also measured (blue line). Typically, the plots of the extent of ligand binding to the receptor and of physiological response at different ligand concentrations differ. In the example shown here, 50 percent of the maximal physiological response is induced at a ligand concentration at which only 18 percent of the receptors are occupied. Likewise, 80 percent of the maximal response is induced when the ligand concentration equals the Kd value, at which 50 percent of the receptors are occupied.
[Leave] [Close]