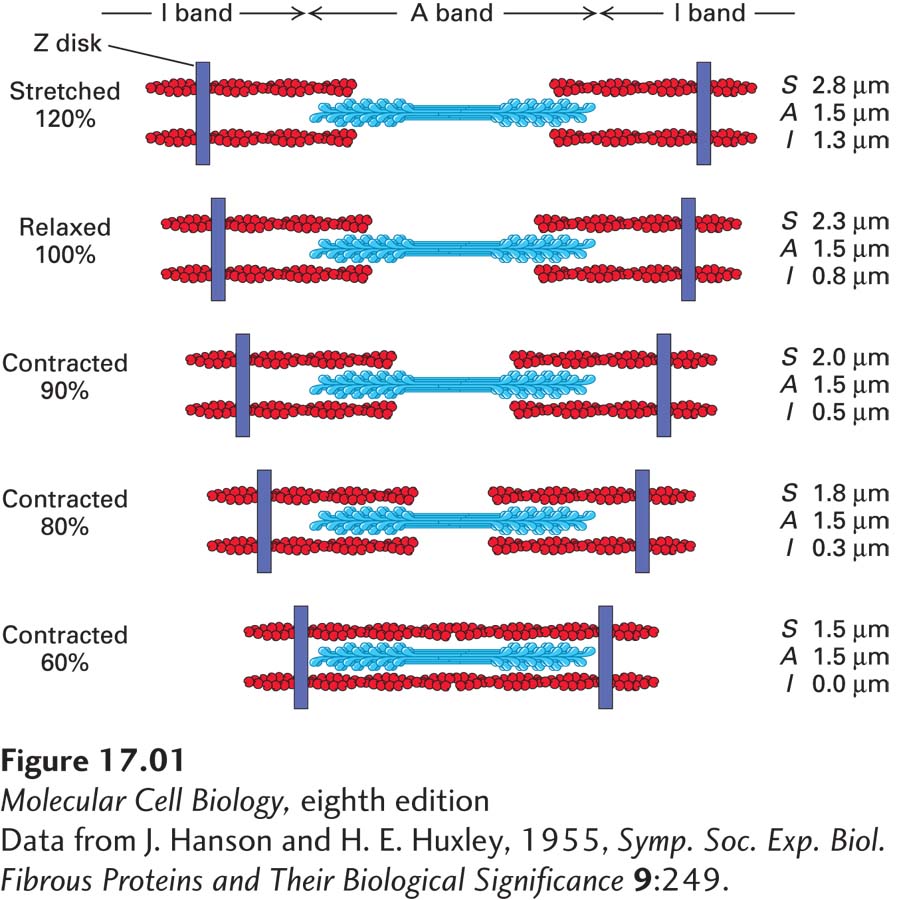
FIGURE 1 Schematic diagram of muscle contraction and stretching observed by Hanson and Huxley. The lengths of the sarcomere (S), the A band (A), and the I band (I) were measured in muscle samples contracted up to 60 percent in length relative to the relaxed muscle (bottom) or stretched up to 120 percent (top). The lengths of the sarcomere, the I band, and the A band are noted on the right. Notice that from 120 percent stretching to 60 percent contraction, the A band does not change in length. However, the length of the I band can stretch to 1.3 µm, and at 60 percent contraction, it disappears as the sarcomere shortens to the overall length of the A band.
[Data from J. Hanson and H. E. Huxley, 1955, Symp. Soc. Exp. Biol. Fibrous Proteins and Their Biological Significance 9:249.]