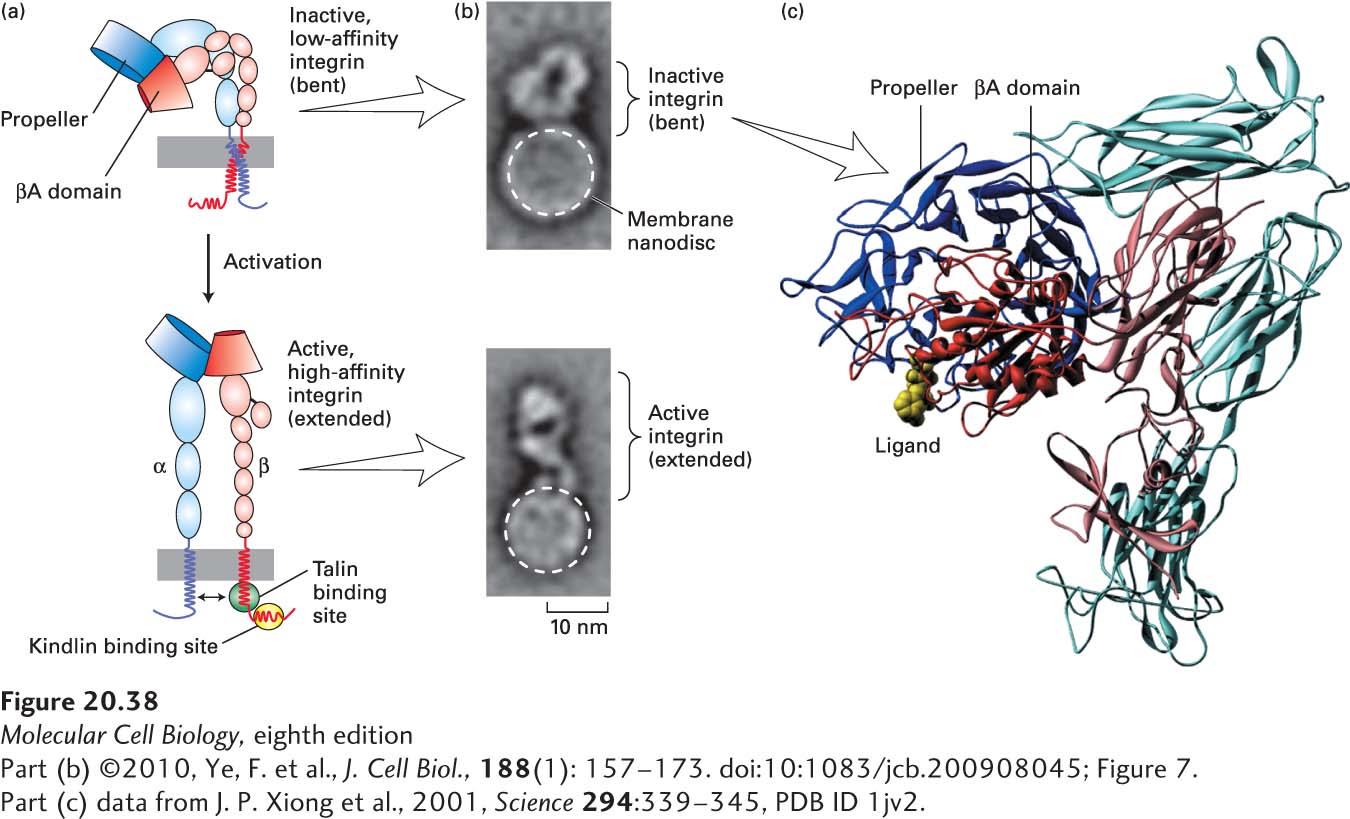
EXPERIMENTAL FIGURE 20- 38 Model for integrin activation. (a) Activation of integrins is thought to be due to conformational changes that include key movements near the propeller and βA domains, which increase the molecule’s affinity for its ligands. These conformational changes are accompanied by straightening of the molecule from the inactive, low- affinity, “bent” conformation (top) to the active, high- affinity, “extended” conformation (bottom). Activation also involves separation (indicated by double- headed arrow, bottom) of the transmembrane and cytoplasmic domains, induced by or resulting in altered interactions with the adapter proteins talin and kindlin, whose sites of binding to the cytoplasmic tail of the β chain are indicated by green and yellow ovals, respectively. (b) Single inactive (bent) integrin αIIbβ3 molecules (top panel) were incorporated into phospholipid nanodiscs (small bilayers in which the extracellular and cytoplasmic domains of the integrin are exposed to a buffer), and the integrin- binding and activating “head” domain of the adapter protein talin was added to some of these preparations (bottom panel). Multiple electron microscopic images of individual nanodiscs were collected and averaged. Phospholipid nanodiscs are indicated by dashed white circles, and the heights of the integrin extracellular regions that extend above the nanodiscs are indicated by brackets. (c) This molecular model of the extracellular region of αvβ3 integrin in its inactive, low- affinity (“bent”) form, with the α subunit in shades of blue and the β subunit in shades of red, is based on x- ray crystallography. The major ligand- binding sites are at the tip of the molecule, where the propeller domain of the α subunit (dark blue) and βA domain (dark red) interact. An RGD peptide ligand is shown in yellow. See M. Arnaout et al., 2002, Curr. Opin. Cell Biol. 14:641; R. O. Hynes, 2002, Cell 110:673; F. Ye et al., 2010, J. Cell Biol. 188:157– 173; and M. Moser et al., 2009, Science 324:895– 899.
[Part (b) ©2010, Ye, F. et al., J. Cell Biol., 188(1): 157– 173. doi:10:1083/jcb.200908045; Figure 7. Part (c) data from J. P. Xiong et al., 2001, Science 294:339– 345, PDB ID 1jv2.]
[Leave] [Close]