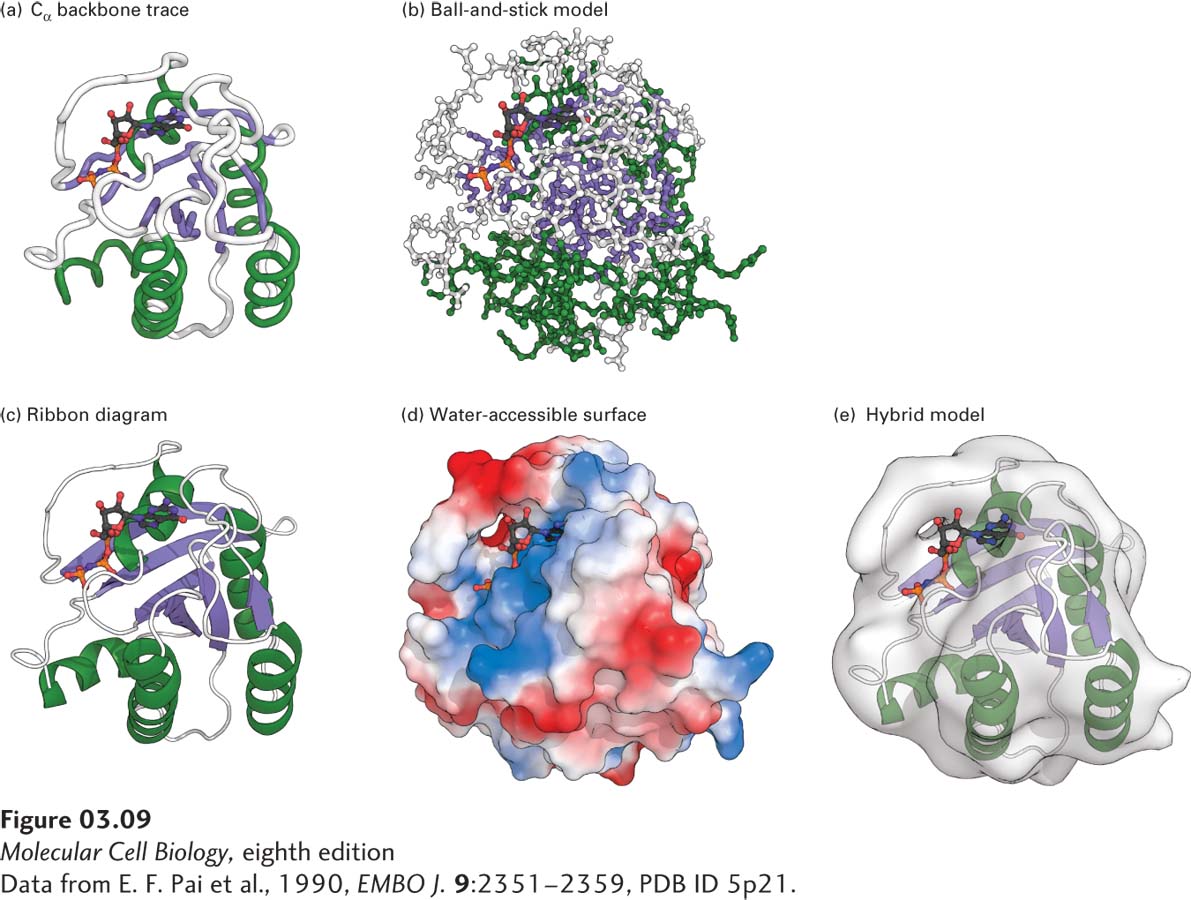
FIGURE 3- 9 Five ways to visualize the protein Ras with its bound GDP. (a) The Cα backbone trace demonstrates how the polypeptide is tightly packed into a small volume. (b) A ball- and- stick representation reveals the locations of all atoms. (c) Turns and loops connect pairs of helices and strands. (d) A water- accessible surface reveals the numerous lumps, bumps, and crevices on the protein surface. Regions of positive charge are shaded purple; regions of negative charge are shaded red. (e) Hybrid model in which ribbon and transparent surface models are combined.
[Data from E. F. Pai et al., 1990, EMBO J. 9:2351– 2359, PDB ID 5p21.]
[Leave] [Close]