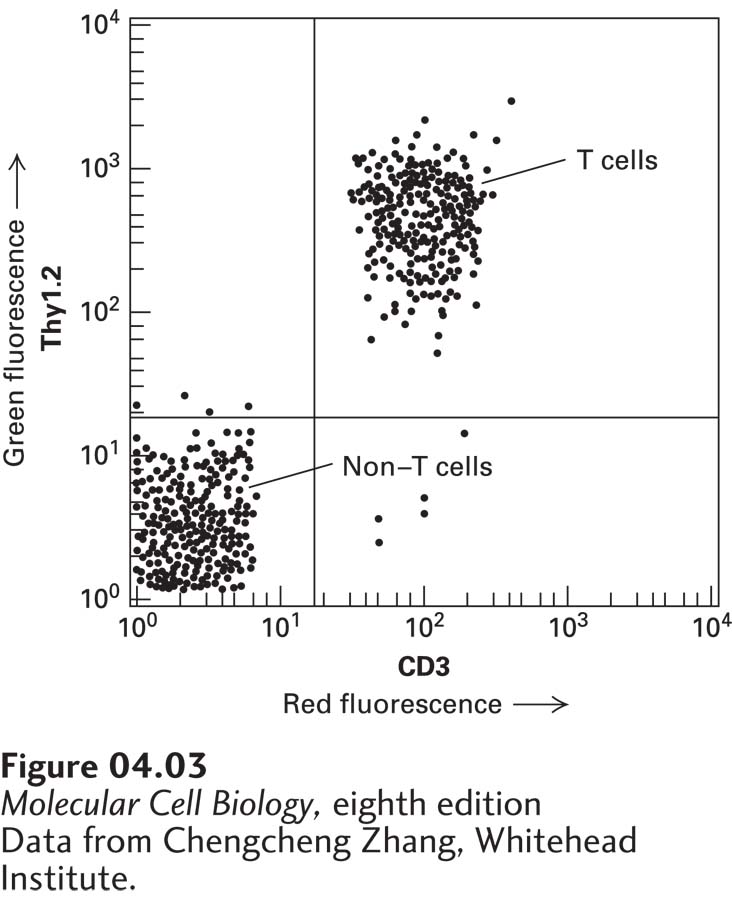
EXPERIMENTAL FIGURE 4- 3 T cells bound to fluorescence- tagged antibodies to two cell- surface proteins are separated from other white blood cells by FACS. Spleen cells from a mouse were treated with a red fluorescent monoclonal antibody specific for the CD3 cell- surface protein and with a green fluorescent monoclonal antibody specific for a second cell- surface protein, Thy1.2. As the cells were passed through a FACS, the intensity of the green and red fluorescence emitted by each cell was recorded. Each dot represents a single cell. This plot of green fluorescence (vertical axis) versus red fluorescence (horizontal axis) for thousands of spleen cells shows that about half of them— the T cells— express both CD3 and Thy1.2 proteins on their surfaces (upper- right quadrant). The remaining cells, which exhibit low fluorescence (lower- left quadrant), express only background levels of these proteins and are other types of white blood cells. Note the logarithmic scale on both axes.
[Data from Chengcheng Zhang, Whitehead Institute.]
[Leave] [Close]