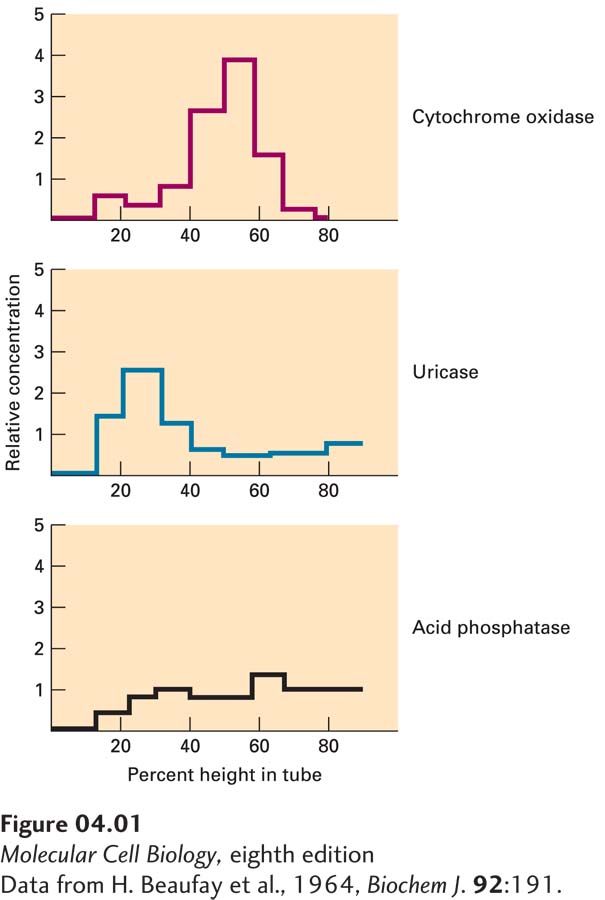
FIGURE 1 Graphic representation of the enzyme analysis of products from a sucrose gradient. The mitochondrial- rich fraction was separated as depicted in Figure 4-37, and then enzyme assays were performed. The relative concentration of active enzyme is plotted on the y axis; the height in the tube is plotted on the x axis. The peak activities of cytochrome oxidase (top) and acid phosphatase (bottom) are observed near the top of the tube. The peak activity of uricase (middle) migrates to the bottom of the tube.
[Data from H. Beaufay et al., 1964, Biochem J. 92:191.]
[Leave] [Close]