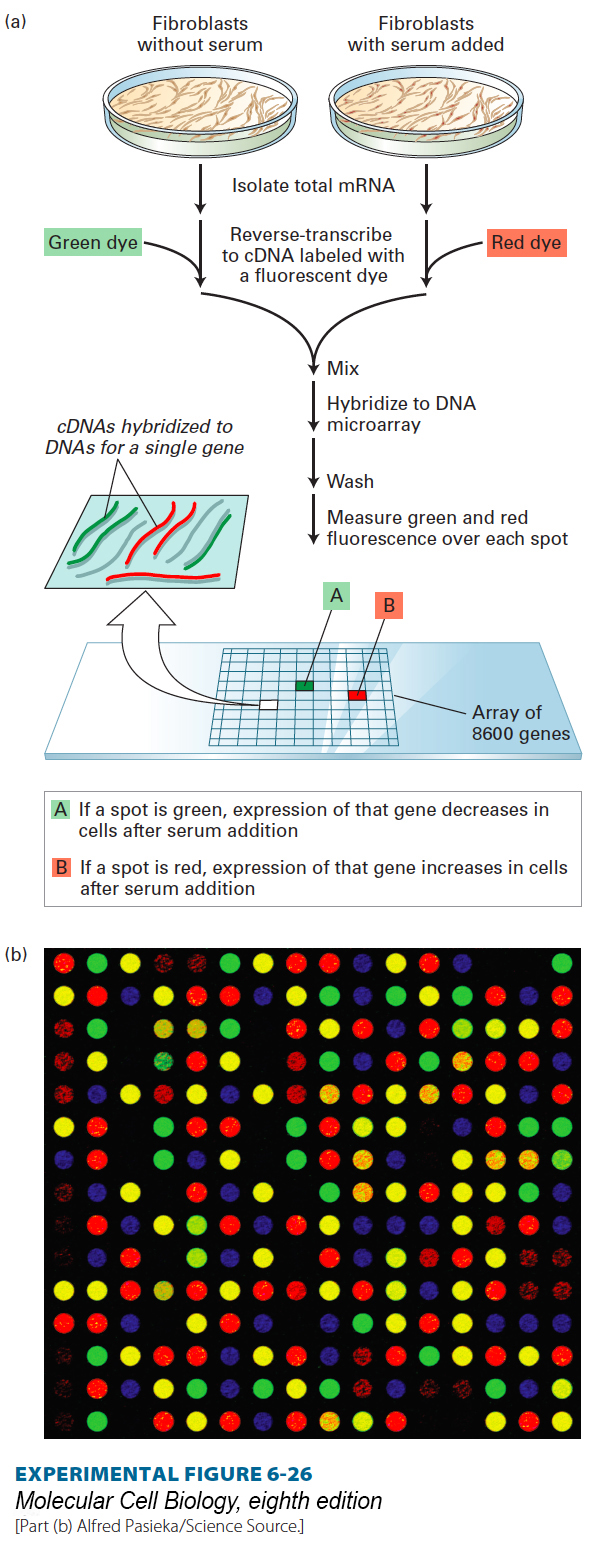
EXPERIMENTAL FIGURE 6- 26 DNA microarray analysis can reveal differences in gene expression in fibroblasts under different experimental conditions. (a) In this example, cDNA prepared from mRNA isolated from fibroblasts either starved for serum or after serum addition is labeled with different fluorescent dyes. A microarray composed of DNA spots representing 8600 mammalian genes is exposed to an equal mixture of the two cDNA preparations under hybridization conditions. The ratio of the intensities of red and green fluorescence over each spot, detected with a scanning confocal laser microscope, indicates the relative expression of each gene in response to serum. (b) A micrograph of a small segment of an actual DNA microarray. Each spot in this 16 × 16 array contains DNA from a different gene hybridized to control and experimental cDNA samples labeled with red and green fluorescent dyes. (A yellow spot indicates equal hybridization of green and red fluorescence, indicating no change in gene expression.)
[Part (b) Alfred Pasieka/Science Source.]
[Leave] [Close]