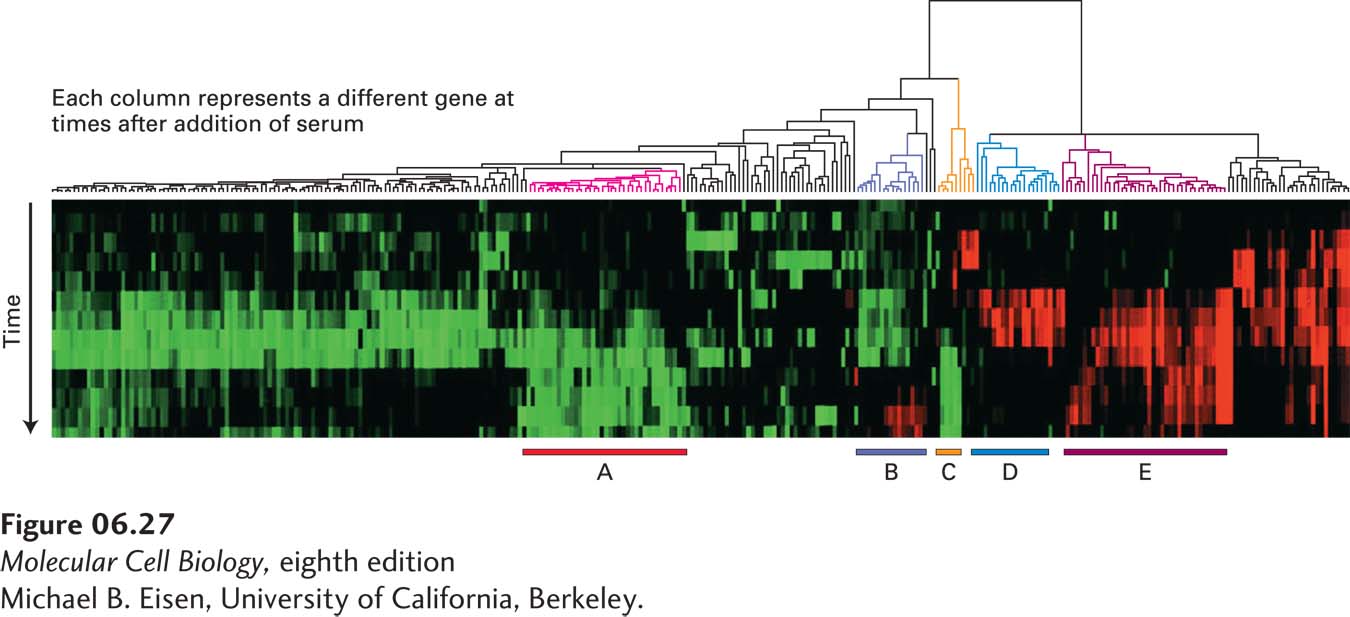
EXPERIMENTAL FIGURE 6- 27 Cluster analysis of data from multiple microarray expression experiments can identify co- regulated genes. The expression of 8600 mammalian genes was detected by microarray analysis at time intervals over a 24- hour period after serum- starved fibroblasts were provided with serum. The cluster diagram shown here is based on a computer algorithm that groups genes showing similar changes in expression compared with a serum- starved control sample over time. Each column of colored boxes represents a single gene, and each row represents a time point. A red box indicates an increase in expression relative to the control; a green box, a decrease in expression; and a black box, no significant change in expression. The “tree” diagram at the top shows how the expression patterns for individual genes can be organized in a hierarchical fashion to group together the genes with the greatest similarity in their patterns of expression over time. Five clusters of coordinately regulated genes were identified in this experiment, as indicated by the bars at the bottom. Each cluster contains multiple genes whose encoded proteins function in a particular cellular process: cholesterol biosynthesis (A), the cell cycle (B), the immediate- early response (C), signaling and angiogenesis (D), and wound healing and tissue remodeling (E).
[Michael B. Eisen, University of California, Berkeley.]
[Leave] [Close]