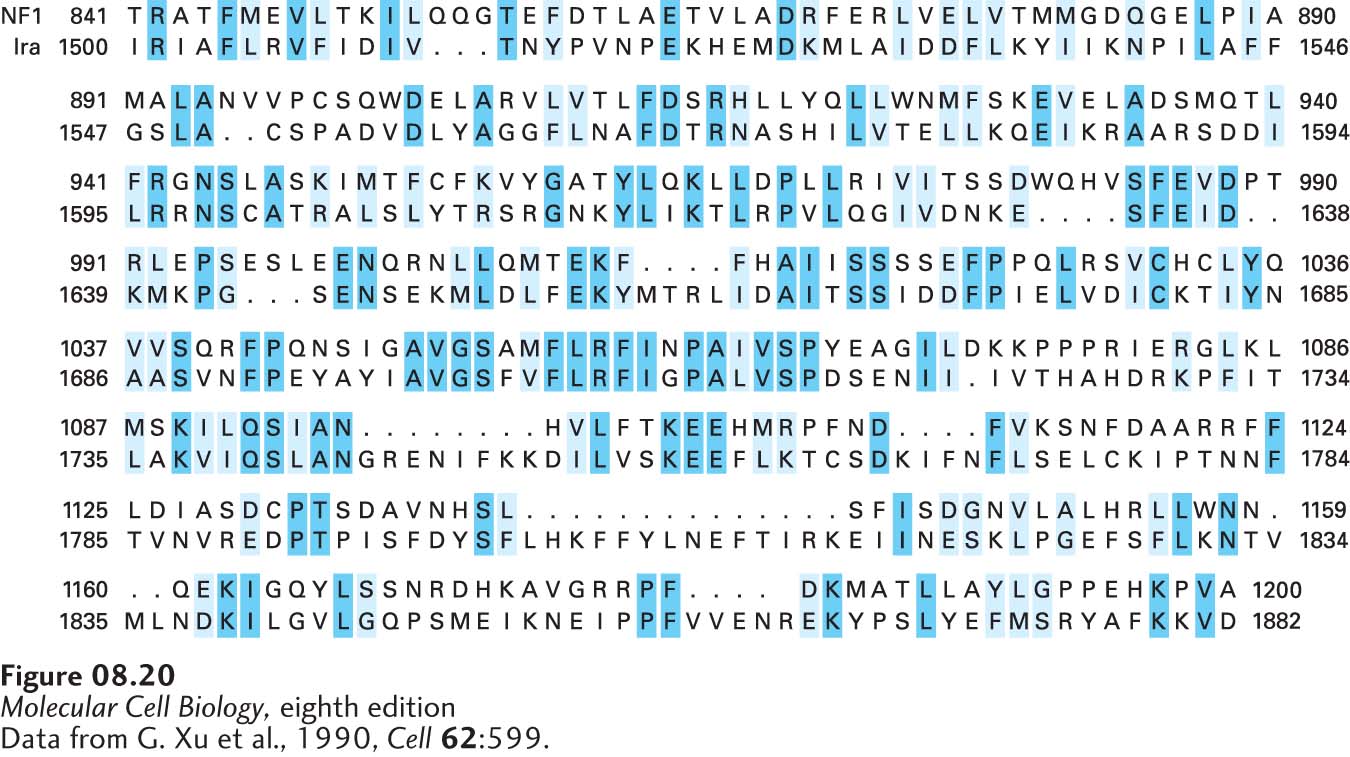
FIGURE 8- 20 Comparison of the regions of human NF1 protein and S. cerevisiae Ira protein that show significant sequence similarity. The NF1 and the Ira sequences are shown on the top and bottom lines of each row, respectively, in the one- letter amino acid code (see Figure 2- 14 ). Amino acids that are identical in the two proteins are highlighted in dark blue. Amino acids with chemically similar but nonidentical side chains are highlighted in light blue. Black dots indicate “gaps” in the upper and lower protein sequences, inserted in order to maximize the alignment of homologous amino acids. The BLAST p-value for these two sequences is 10−28, indicating a high degree of similarity.
[Data from G. Xu et al., 1990, Cell 62:599.]
[Leave] [Close]