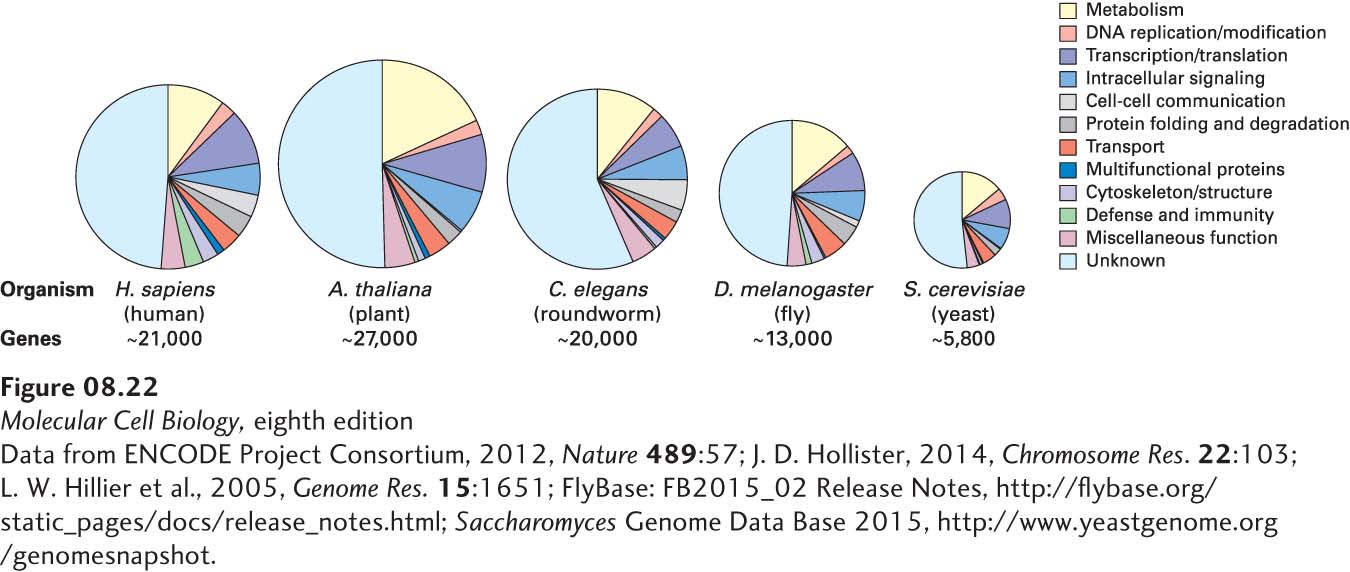
FIGURE 8- 22 Comparison of the number and types of proteins encoded in the genomes of different eukaryotes. For each organism, the area of the entire pie chart represents the total number of protein- coding genes, all shown at roughly the same scale. In most cases, the functions of the proteins encoded by about half the genes are still unknown (light blue). The functions of the remainder are known or have been predicted by sequence similarity to genes of known function.
[Data from ENCODE Project Consortium, 2012, Nature 489:57; J. D. Hollister, 2014, Chromosome Res. 22:103; L. W. Hillier et al., 2005, Genome Res. 15:1651; FlyBase: FB2015_02 Release Notes, http://flybase.org/static_pages/docs/release_notes.html; Saccharomyces Genome Data Base 2015, http://www.yeastgenome.org/genomesnapshot.]
[Leave] [Close]