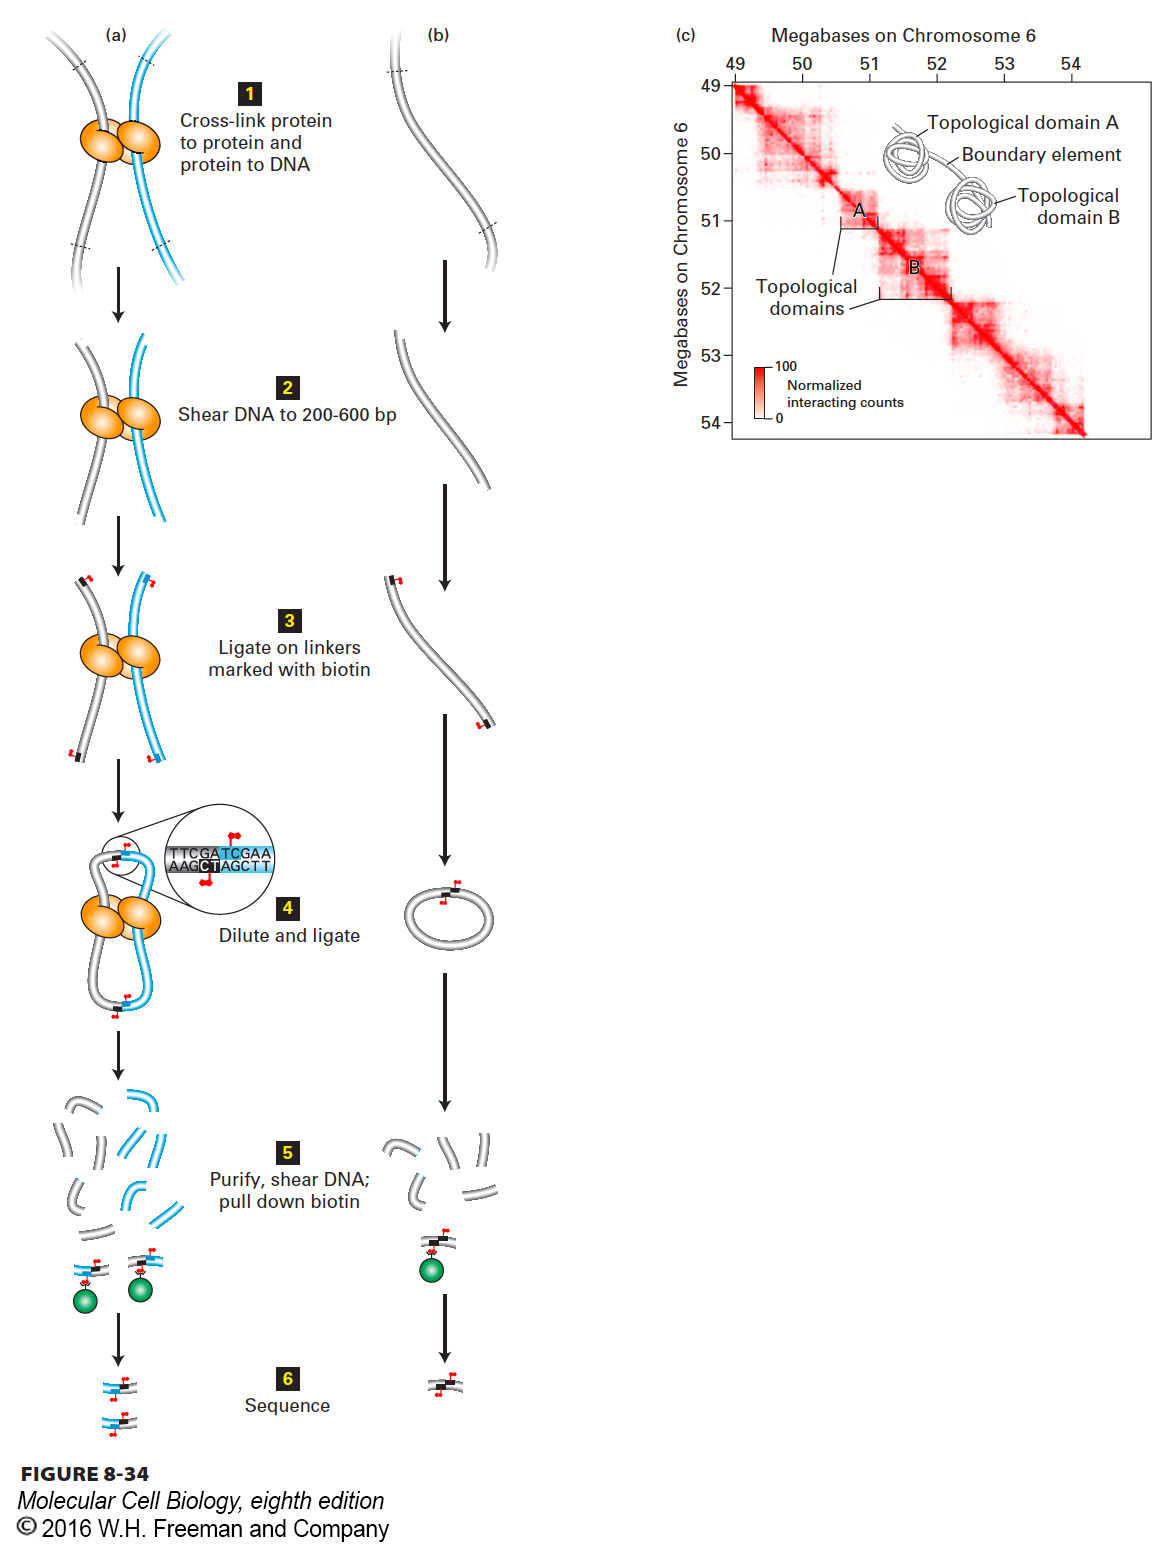
FIGURE 8- 34 Chromosome conformation capture. (a, b) Strategy of chromatin conformation capture methods. See text for explanation. Gray and blue tubes represent regions of DNA separated by >10 kb in the genome sequence. Biotin is represented by red flags. See E. Lieberman- Aiden, 2009, Science 326:289. (c) Heat map of chromosome conformation capture data for a region of chromosome 6 in mouse embryonic stem cells. The sequence from 49 to 54 Mb from the left end of chromosome 6 is represented on both axes. Each pixel shows data from a 10 kb sequence. The number of times a sequence from one 10- kb region indicated on the x axis was ligated to a sequence from a second 10- kb region on the y axis is indicated by the intensity of red color, as shown in the key at the lower left. A value of 100 (dark red) indicates that a sequence anywhere within the 10- kb region on the x axis was found ligated to a sequence from anywhere in the 10- kb region on the y axis 100 times. Since the probability that two ends generated by sonication will be ligated together is higher for ends that are close together than for ends that are far apart, the intensity of the red color in any pixel indicates the relative proximity of the sequences in the two 10- kb intervals in the nuclei at the time of cross- linking. Inset shows a model of chromatin folding that is consistent with these results.
[Part (c) data from J. R. Dixon, 2012, Nature 485:376.]
[Leave] [Close]