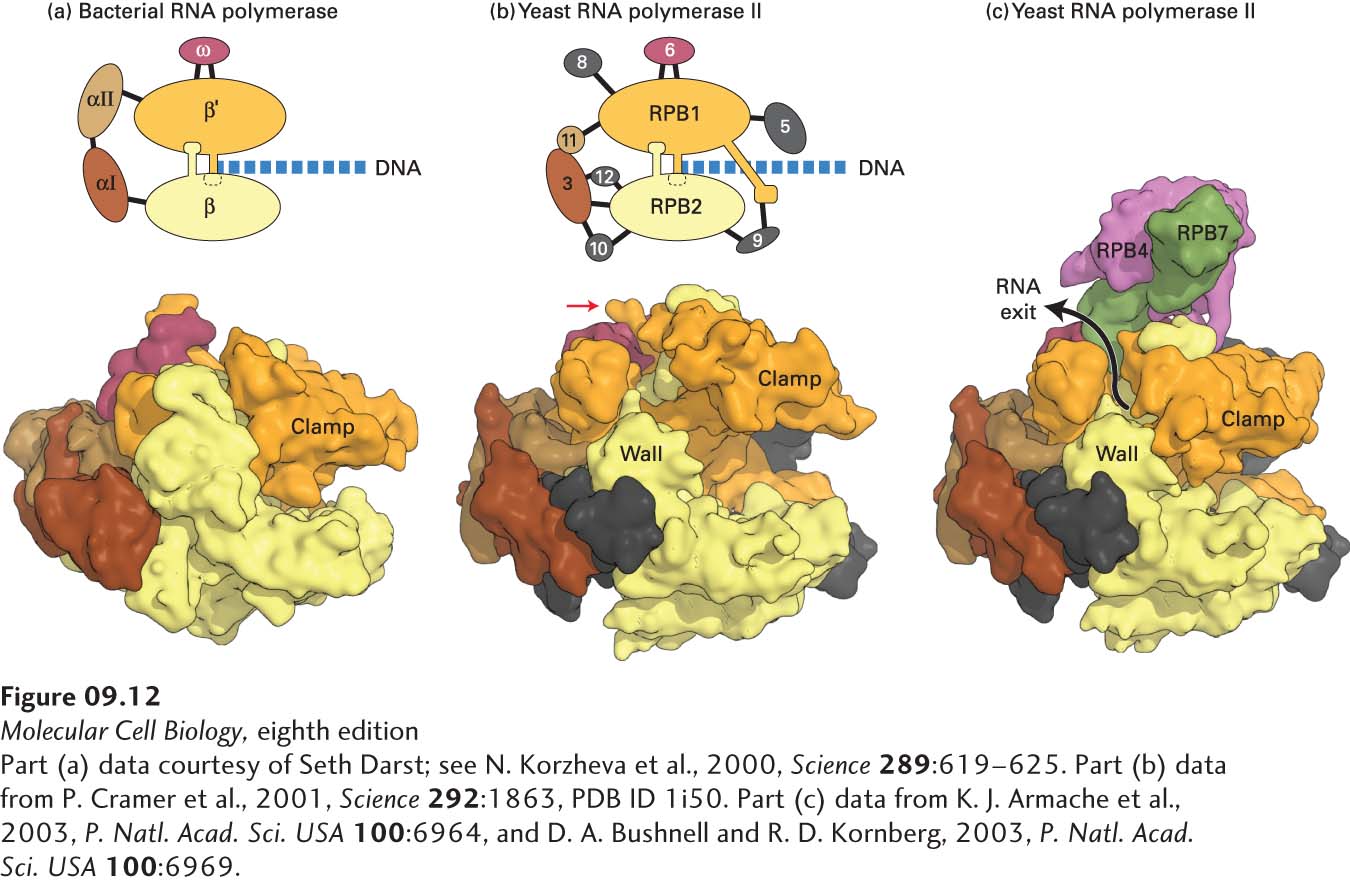
FIGURE 9- 12 Comparison of three- dimensional structures of bacterial and eukaryotic RNA polymerases. (a, b) These space- filling models are based on x- ray crystallographic analysis. (a) RNA polymerase from the bacterium T. aquaticus. The five subunits of the bacterial enzyme are distinguished by color. Only the N- terminal domains of the α subunits are included in this model. (b) Core RNA polymerase II from S. cerevisiae. Ten of the 12 subunits constituting yeast RNA polymerase II are shown in this model. Subunits that are similar in conformation to those in the bacterial enzyme are shown in the same colors. The C- terminal domain of the large subunit RPB1 was not observed in the crystal structure, but it is known to extend from the position marked with a red arrow. (RPB is the abbreviation for “RNA polymerase B,” which is an alternative way of referring to RNA polymerase II.) DNA entering the polymerases as they transcribe to the right is diagrammed. (c) Space- filling model of yeast RNA polymerase II including subunits 4 and 7. These subunits extend from the core portion of the enzyme shown in (b) near the region of the C- terminal domain of the large subunit.
[Part (a) data courtesy of Seth Darst; see N. Korzheva et al., 2000, Science 289:619– 625. Part (b) data from P. Cramer et al., 2001, Science 292:1863, PDB ID 1i50. Part (c) data from K. J. Armache et al., 2003, P. Natl. Acad. Sci. USA 100:6964, and D. A. Bushnell and R. D. Kornberg, 2003, P. Natl. Acad. Sci. USA 100:6969.]
[Leave] [Close]