image
FIGURE 9-20 Model Of The Yeast preinitiation complex based on cryoelectron microscopy and fitting of known protein x-ray crystal structures. (a-c) Three views of the nearly complete PIC. The relative positions of Pol II and most of the GTFs are observed, but only about 50% of the mass of TFIIH is depicted because a large part of the mass of TFIIH is highly flexible and consequently could not be accurately determined by cryo-EM. Also high resolution structures have not been determined for many of the TFIIH subunits, and consequently could not be fitted to the TFIIH mass detected by cryo-EM. However, the interaction between DNA at the downstream side of the Pol II cleft and the TFIIH Ssl2 helicase subunit required to melt promoter DNA is clearly visualized in (b) and (c). In (c), the interaction between TFIIH and TFIIE is not visualized because of the low resolution of the complex in this region. TFIIS is a Pol II elongation factor added to stabilize the PIC. (d) Model of entry of the template strand into the floor of the cleft where RNA polymerization is catalyzed. The Ssl2 helicase pushes DNA that is bound upstream to TBP, TFIIB, and TFIIA, creating torsional stress that contributes to transcription bubble melting.
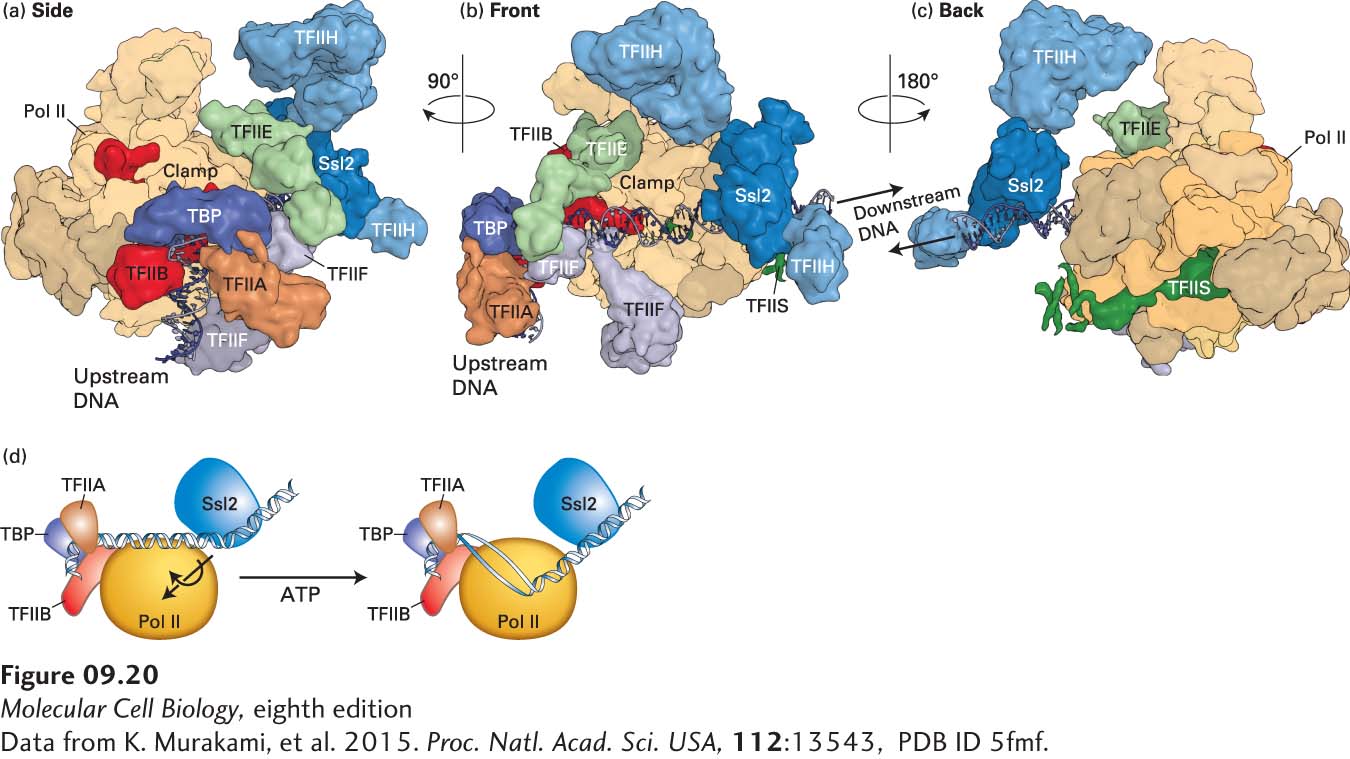
[Data from K. Murakami, et al. 2015. Proc. Natl. Acad. Sci. USA, 112:13543, PDB ID 5fmf.]