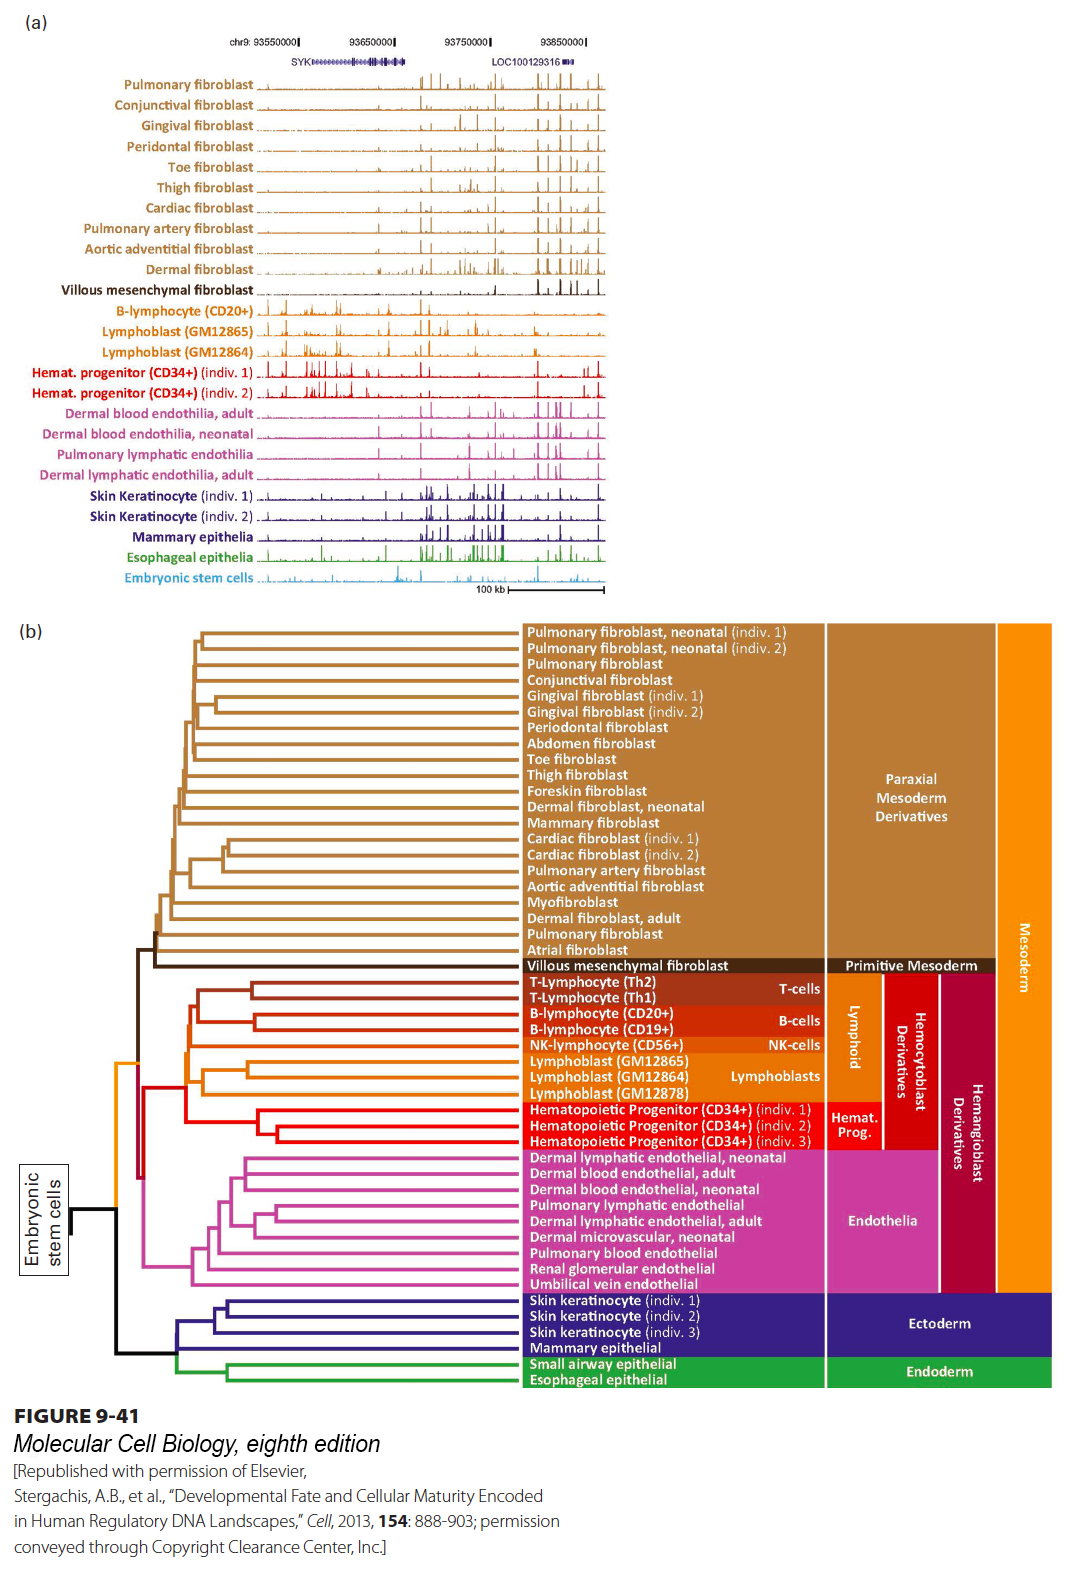
FIGURE 9- 41 Maps of DNase I hypersensitive sites in embryonic and adult cells reflect their developmental history. (a) DHSs from each of the human cell types shown at the left are mapped in the interval on chromosome 12 between 96.2 and 96.8 Mb from the left end. The height of each vertical bar in the figure represents the number of times a sequence in a 50- bp interval at that position was sequenced after following the protocol described in the text to ligate a linker of known sequence to DNA ends resulting from low- level DNase I digestion of chromatin. The plots are color- coded according to the embryonic tissue from which they developed, as shown in (b). (b) Dendrogram showing the relationships among the DHS maps for each cell type across the entire genome. The embryonic tissue from which each of these cell types develops is shown at the right. Embryonic stem cells form the root of the dendrogram. The DHS maps for all other cell types are derived from those for the embryonic stem cell by loss of some DHSs and the acquisition of other DHSs. The dendrogram, based on how closely DHS maps from two cell types are related, parallels the developmental relationships among the cell types.
[Republished with permission of Elsevier, Stergachis, A.B., et al., “Developmental Fate and Cellular Maturity Encoded in Human Regulatory DNA Landscapes,” Cell, 2013, 154: 888- 903; permission conveyed through Copyright Clearance Center, Inc.]
[Leave] [Close]