The Mechanism of Action of the Ca2+ Pump Is Known in Detail
Because the calcium pump constitutes more than 80 percent of the integral membrane protein in muscle SR membranes, it is easily purified and has been studied extensively. Determination of the three-dimensional structure of this protein in several conformational states, representing different steps in the pumping process, has revealed much about its mechanism of action, which serves as a paradigm for understanding many P-class ATPases.
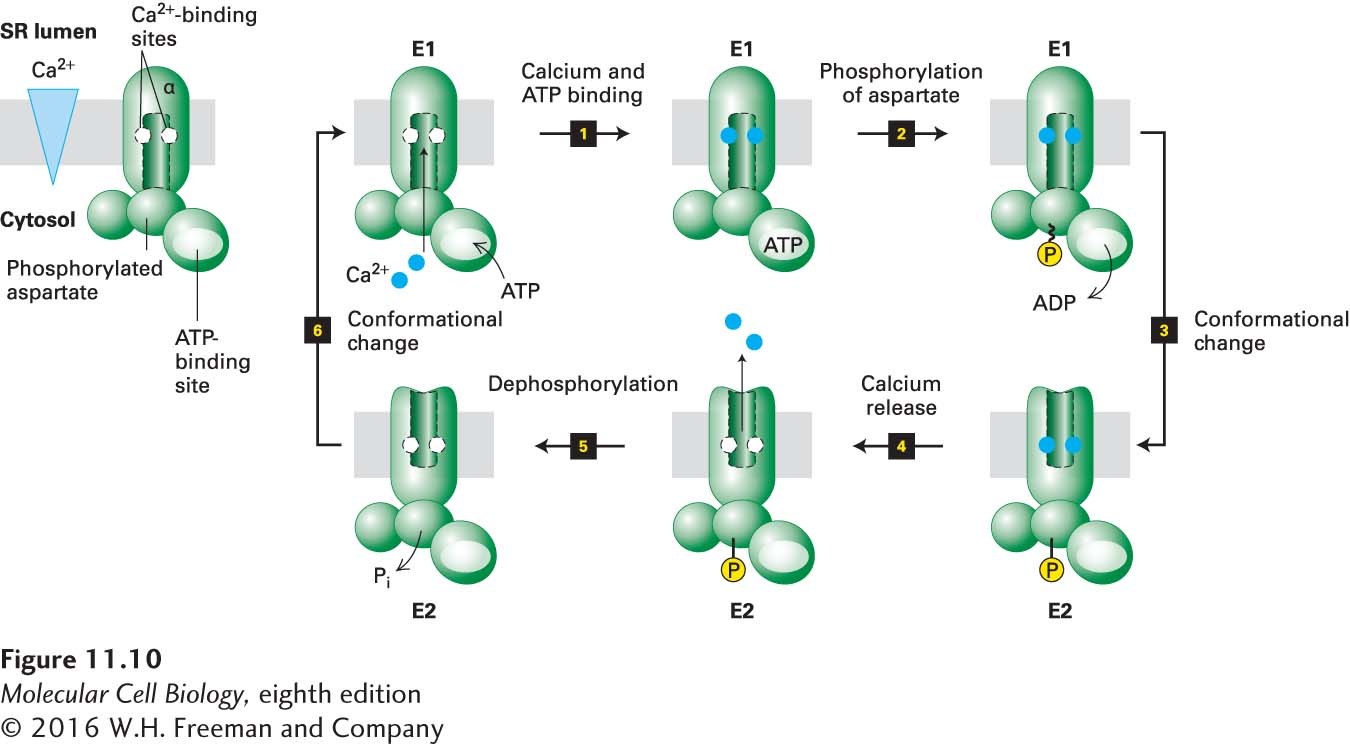
The current model for the mechanism of action of the Ca2+ ATPase in the SR membrane involves multiple conformational states. For simplicity, we group these into E1 states, in which the two binding sites for Ca2+, located in the center of the membrane-spanning domain, face the cytosol, and E2 states, in which these binding sites face the exoplasmic face of the membrane, pointing into the lumen of the SR. The coupling of ATP hydrolysis with ion pumping involves several conformational changes in the protein that must occur in a defined order, as shown in Figure 11-10. When the protein is in the E1 conformation, two Ca2+ ions bind to two high-affinity binding sites accessible from the cytosolic side; even though the cytosolic Ca2+ concentration is low (see Table 11-2), calcium ions still fill these sites.
FIGURE 11-10Operational model of the Ca2+ ATPase in the SR membrane of skeletal muscle cells. Only one of the two catalytic α subunits of this P-class pump is depicted. E1 and E2 are alternate conformations of the protein in which the Ca2+-binding sites are accessible from the cytosolic and exoplasmic (SR lumen) faces of the membrane, respectively. An ordered sequence of steps, as diagrammed here, is essential for coupling ATP hydrolysis with the transport of Ca2+ ions across the membrane. In the figure, ~P indicates a high-energy aspartyl phosphate bond; –P indicates a low-energy bond. Because the affinity of Ca2+ for the cytosolic-facing binding sites in E1 is 1000-fold greater than its affinity for the exoplasmic-facing sites in E2, this pump transports Ca2+ unidirectionally from the cytosol to the SR lumen. See the text and Figure 11-11 for more details. See C. Toyoshima and G. Inesi, 2004, Annu. Rev. Biochem.73:269–292.
Next an ATP binds to a site on the cytosolic surface (step 1). The bound ATP is hydrolyzed to ADP in a reaction that requires Mg2+, and the liberated phosphate is transferred to a specific aspartate residue in the protein, forming the high-energy acyl phosphate bond denoted by E1~P (step 2). The protein then undergoes a conformational change that generates E2, in which the affinity of the two Ca2+-binding sites is reduced (shown in detail in the next figure) and in which these sites are now accessible to the SR lumen (step 3). The free energy of hydrolysis of the aspartyl-phosphate bond in E1~P is greater than that in E2–P, and this reduction in the free energy of the aspartyl-phosphate bond can be said to power the E1 → E2 conformational change.
The Ca2+ ions spontaneously dissociate from the binding sites to enter the SR lumen because even though the Ca2+ concentration there is higher than in the cytosol, it is lower than the Kd for Ca2+ binding in the low-affinity state (step 4). Finally, the aspartyl-phosphate bond is hydrolyzed (step 5). This dephosphorylation, coupled with subsequent binding of cytosolic Ca2+ to the high-affinity E1 Ca2+ binding sites, stabilizes the E1 conformational state relative to E2; furthermore, it can be said to power the E2 → E1 conformational change (step 6). Now E1 is ready to transport two more Ca2+ ions. Thus the cycle is complete, and hydrolysis of one phosphoanhydride bond in ATP has powered the pumping of two Ca2+ ions against a concentration gradient into the SR lumen.
Much structural and biophysical evidence supports the model depicted in Figure 11-10. For instance, the muscle calcium pump has been isolated with phosphate linked to the key aspartate residue, and spectroscopic studies have detected slight alterations in protein conformation during the E1 → E2 conversion. The two phosphorylated states can also be distinguished biochemically; addition of ADP to phosphorylated E1 results in synthesis of ATP, the reverse of step 2 in Figure 11-10, whereas addition of ADP to phosphorylated E2 does not. Each principal conformational state of the reaction cycle can also be characterized by a different susceptibility to various proteolytic enzymes such as trypsin.
Page 487
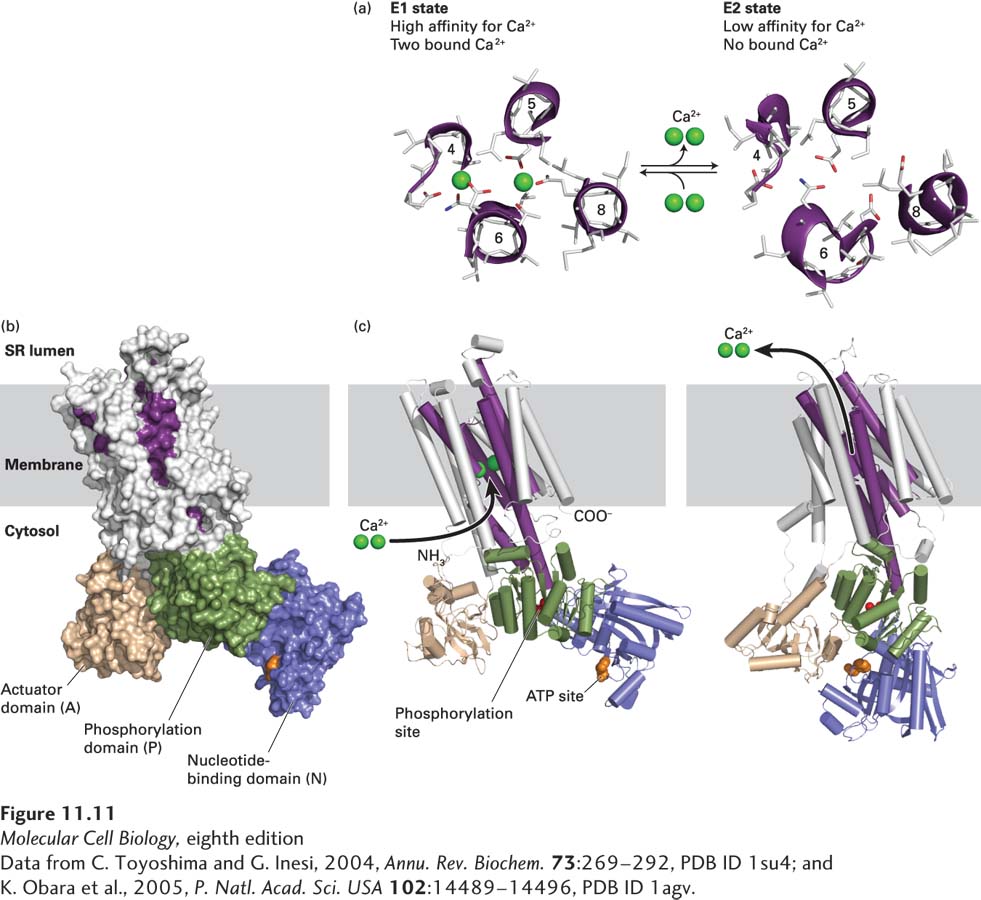
Figure 11-11 shows the three-dimensional structure of the Ca2+ pump in the E1 state. As can be seen in Figure 11-11c, the 10 membrane-spanning α helices in the catalytic subunit form the passageway through which Ca2+ ions move. Amino acids in four of these helices form the two high-affinity E1 Ca2+-binding sites (Figure 11-11a, left). One site is formed from negatively charged oxygen atoms from the carboxyl groups (COO−) of glutamate and aspartate side chains, as well as from bound water molecules. The other site is formed from side- and main-chain oxygen atoms. Thus as Ca2+ ions bind to the Ca2+ pump, they lose the water molecules that normally surround a Ca2+ ion in aqueous solution (see Figure 2-7), but these waters are replaced by oxygen atoms with a similar geometry that are part of the transport protein. In contrast, in the E2 state (Figure 11-11a, right), several of these binding side chains have moved fractions of a nanometer and are unable to interact with bound Ca2+ ions, accounting for the low affinity of the E2 state for Ca2+ ions.
[Data from C. Toyoshima and G. Inesi, 2004, Annu. Rev. Biochem.73:269–292, PDB ID 1su4; and K. Obara et al., 2005, P. Natl. Acad. Sci. USA102:14489–14496, PDB ID 1agv.]
FIGURE 11-11Structure of the catalytic subunit of the muscle Ca21 ATPase. (a) Ca2+-binding sites in the E1 state (left), with two bound calcium ions, and the low-affinity E2 state (right), without bound ions. Side chains of key amino acids are white, and the oxygen atoms on the glutamate and aspartate side chains are red. In the high-affinity E1 conformation, Ca2+ ions bind at two sites between helices 4, 5, 6, and 8 inside the membrane. One site is formed out of negatively charged oxygen atoms from glutamate and aspartate side chains and from water molecules (not shown), and the other is formed out of side-and main-chain oxygen atoms. Seven oxygen atoms surround the Ca2+ ion in both sites. (b) Three-dimensional model of the protein in the E1 state based on the structure determined by x-ray crystallography. There are 10 transmembrane α helices, four of which (purple) contain residues that participate in Ca2+ binding. The cytosolic segment forms three domains: the nucleotide-binding domain (N, blue), the phosphorylation domain (P, green), and the actuator domain (A, beige), which connects two of the membrane-spanning helices. (c) Models of the pump in the E1 state (left) and in the E2 state (right). Note the differences between the E1 and E2 states in the conformations of the N and A domains. Movements of these domains power the conformational changes of the membrane-spanning α helices (purple) that constitute the Ca2+-binding sites, converting them from a conformation in which the Ca2+-binding sites are accessible from the cytosolic face (E1 state) to one in which the now loosely bound Ca2+ ions gain access to the exoplasmic face (E2 state).
[Data from C. Toyoshima and G. Inesi, 2004, Annu. Rev. Biochem.73:269–292, PDB ID 1su4; and K. Obara et al., 2005, P. Natl. Acad. Sci. USA102:14489–14496, PDB ID 1agv.]
The binding of Ca2+ ions to the Ca2+ pump illustrates a general principle of ion binding to membrane transport proteins that we will encounter repeatedly in this chapter: as ions bind, they lose most of their waters of hydration, but interact with oxygen atoms in the transport protein that have a geometry similar to that of the water oxygens that are bound to them in aqueous solution. This reduces the thermodynamic barrier for ion binding to the protein and allows tight binding of the ion even from solutions of relatively low concentrations.
The cytosolic region of the Ca2+ pump consists of three domains that are well separated from one another in the E1 state (Figure 11-11b). Each of these domains is connected to the membrane-spanning helices by short segments of amino acids. Movements of these cytosolic domains during the pumping cycle cause movements of the connecting segments, which are transmitted into movements of the attached membrane-spanning α helices. For example, the phosphorylated residue, Asp 351, is located in the phosphorylation (P) domain. The adenosine moiety of ATP binds to the nucleotide-binding (N) domain, but the γ phosphate of ATP binds to specific residues on the P domain, requiring movements of both the N and P domains. Thus, following ATP and Ca2+ binding, the γ phosphate of the bound ATP sits adjacent to the aspartate on the P domain that is to receive the phosphate. Although the precise details of these and other protein conformational changes are not yet clear, the movements of the N and P domains are transmitted by lever-like motions of the connecting segments into rearrangements of several membrane-spanning α helices. These changes are especially apparent in the four helices that contain the two Ca2+-binding sites: the changes prevent the bound Ca2+ ions from moving back into the cytosol when released, but enable them to dissociate into the exoplasmic space (lumen).
Page 488
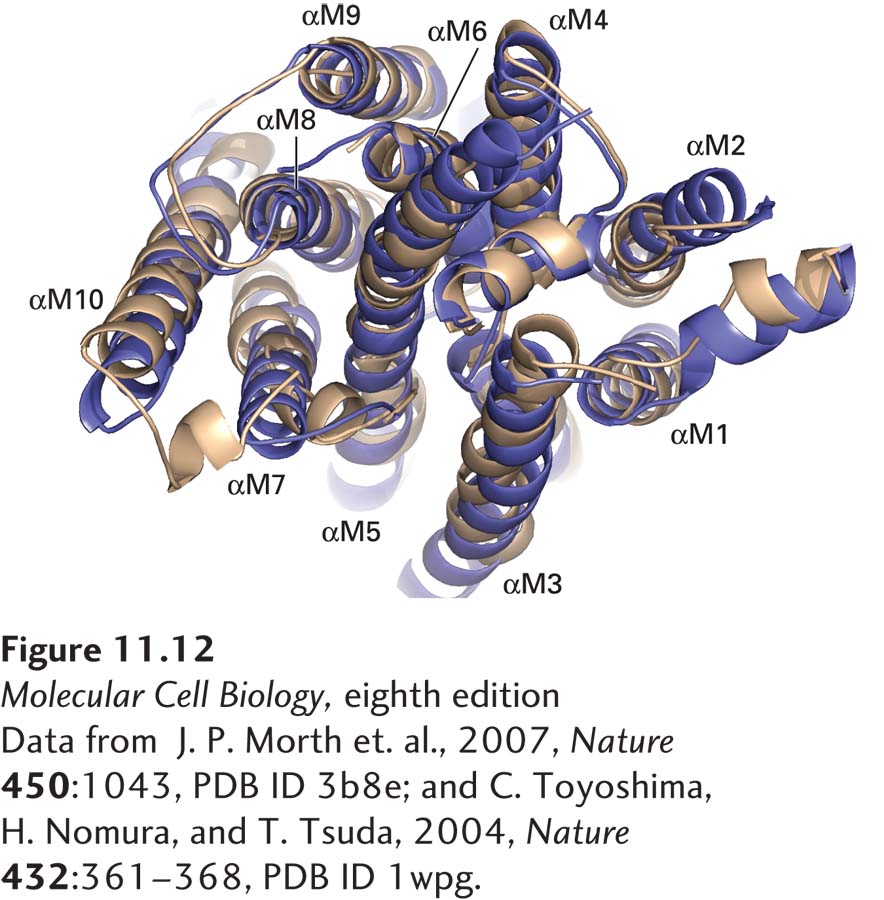
All P-class ATP-powered pumps, regardless of which ion they transport, are phosphorylated on a highly conserved aspartate residue during the transport process. As deduced from cDNA sequences, the catalytic α subunits of all the P-class pumps examined to date have similar amino acid sequences and thus are presumed to have similar arrangements of transmembrane α helices and cytosol-facing A (actuator), P, and N domains (see Figure 11-11). These findings strongly suggest that all such proteins evolved from a common precursor, although they now transport different ions. This suggestion is borne out by the similarities of the three-dimensional structures of the membrane-spanning segments of the Na+/K+ ATPase and the Ca2+ pump (Figure 11-12); the molecular structures of the three cytoplasmic domains are also very similar. Thus the operational model in Figure 11-11 is generally applicable to all of the P-class ATP-powered pumps.
Page 489
[Data from J. P. Morth et al., 2007, Nature450:1043, PDB ID 3b8e; and C. Toyoshima, H. Nomura, and T. Tsuda, 2004, Nature432:361–368, PDB ID 1wpg.]
FIGURE 11-12Structural comparison of Na+/K+ ATPase and muscle Ca2+ ATPase. Three-dimensional structure of the Na+/K+ ATPase (gold) compared with that of the muscle Ca2+ ATPase (purple), as seen from the cytoplasmic surface. αM1–αM10 denote the 10 membrane-spanning α helices of the Na+/K+ ATPase.
[Data from J. P. Morth et al., 2007, Nature450:1043, PDB ID 3b8e; and C. Toyoshima, H. Nomura, and T. Tsuda, 2004, Nature432:361–368, PDB ID 1wpg.]