Classic Experiment 17-1
Looking at Muscle Contraction
H. Huxley and J. Hanson, 1954, Nature 173:973–
The contraction and relaxation of skeletal muscles allow us to perform all of our daily tasks. How do these processes happen? Scientists have long looked to see how fused muscle cells, called myofibrils, differ from other cells that cannot perform powerful movements. In 1954, Jean Hanson and Hugh Huxley published their microscopy studies on muscle contraction, which demonstrated the mechanism by which it occurs.
Background
The ability of muscles to perform work has long been a fascinating process. Voluntary muscle contraction is performed by skeletal muscles, also called striated muscles because of their appearance when viewed under the microscope. By the 1950s, biologists studying myofibrils had named many of the structures they observed under the microscope. One contracting unit, called a sarcomere, is made up of two main regions, called the A band and the I band. The A band contains two darkly colored thick striations and one thin striation. The I band is made up primarily of light-
With these observations in mind, Hanson and Huxley began their study of cross striations in muscle. In a few short years, they united the biochemical data with the microscopy observations and developed a model for muscle contraction that still holds true today.
The Experiment
Hanson and Huxley primarily used phase-
In their first set of studies, Hanson and Huxley employed chemicals that are known to specifically extract either myosin or actin from myofibrils. They first treated myofibrils with a chemical that specifically removes myosin from muscle and then used phase-
With a better understanding of the biochemical nature of muscle structures, Huxley and Hanson went on to study the mechanism of muscle contraction. They isolated individual myofibrils from muscle tissue and treated them with ATP, which caused the myofibrils to contract at a slow rate. Using this technique, they could take pictures of various stages of muscle contraction observed using phase-
Huxley and Hanson first treated myofibrils with ATP, then photographed them under phase-
Next the two scientists examined how the myofibril structure changes during a simulated muscle stretch. They stretched isolated myofibrils mounted on glass slides by manipulating the coverslip. They again photographed the myofibrils under phase-
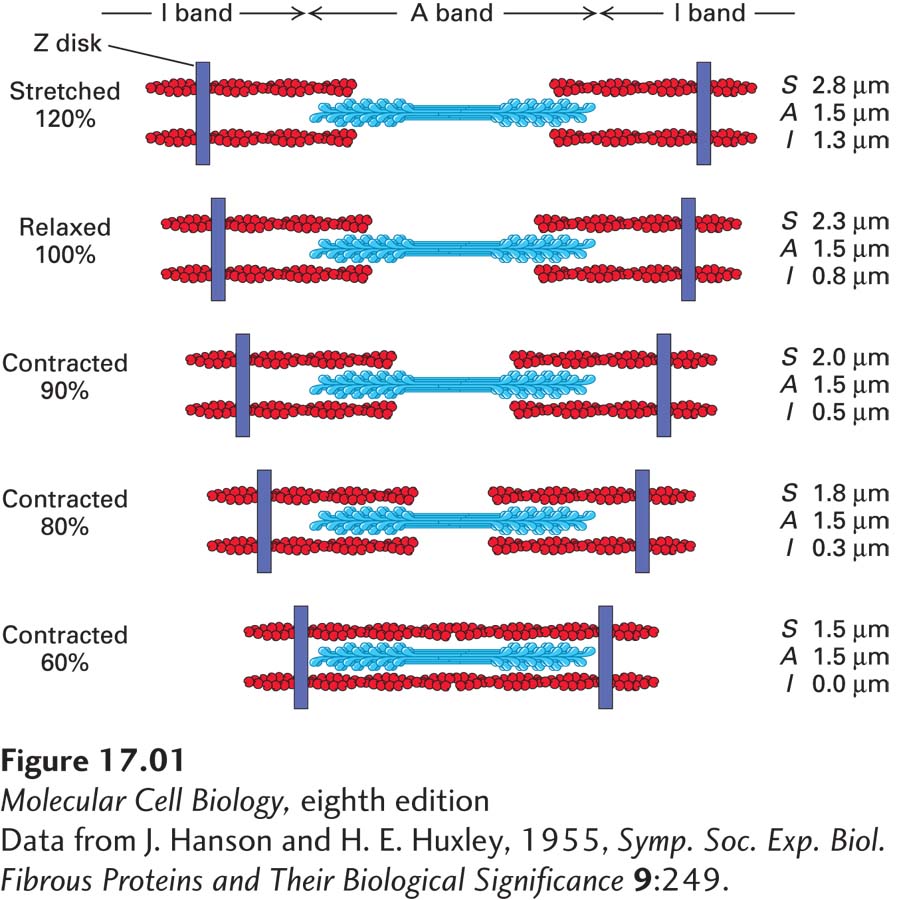
From their observations, Hanson and Huxley developed a model for muscle contraction and stretching (Figure 1). In their model, the actin filaments in the I band are drawn up into the A band during contraction, and thus the I band becomes shorter. This allows for increased interaction between the myosin located in the A band and the actin filaments. As the muscle stretches, the actin filaments withdraw from the A band. From these data, Hanson and Huxley proposed that muscle contraction is driven by actin filaments moving in and out of a mass of stationary myosin filaments.
Discussion
By combining microscopic observations with biochemical treatments of muscle fibers, Hanson and Huxley were able to describe the biochemical nature of muscle structures and outline a mechanism for muscle contraction. A large body of research continues to focus on understanding the process of muscle contraction. Scientists now know that muscles contract by ATP hydrolysis, which drives a conformational change in myosin that allows it to pull on actin. Researchers are continuing to uncover the molecular details of this process, whereas the mechanism of contraction proposed by Hanson and Huxley remains in place.