Different Ways of Depicting the Conformation of Proteins Convey Different Types of Information
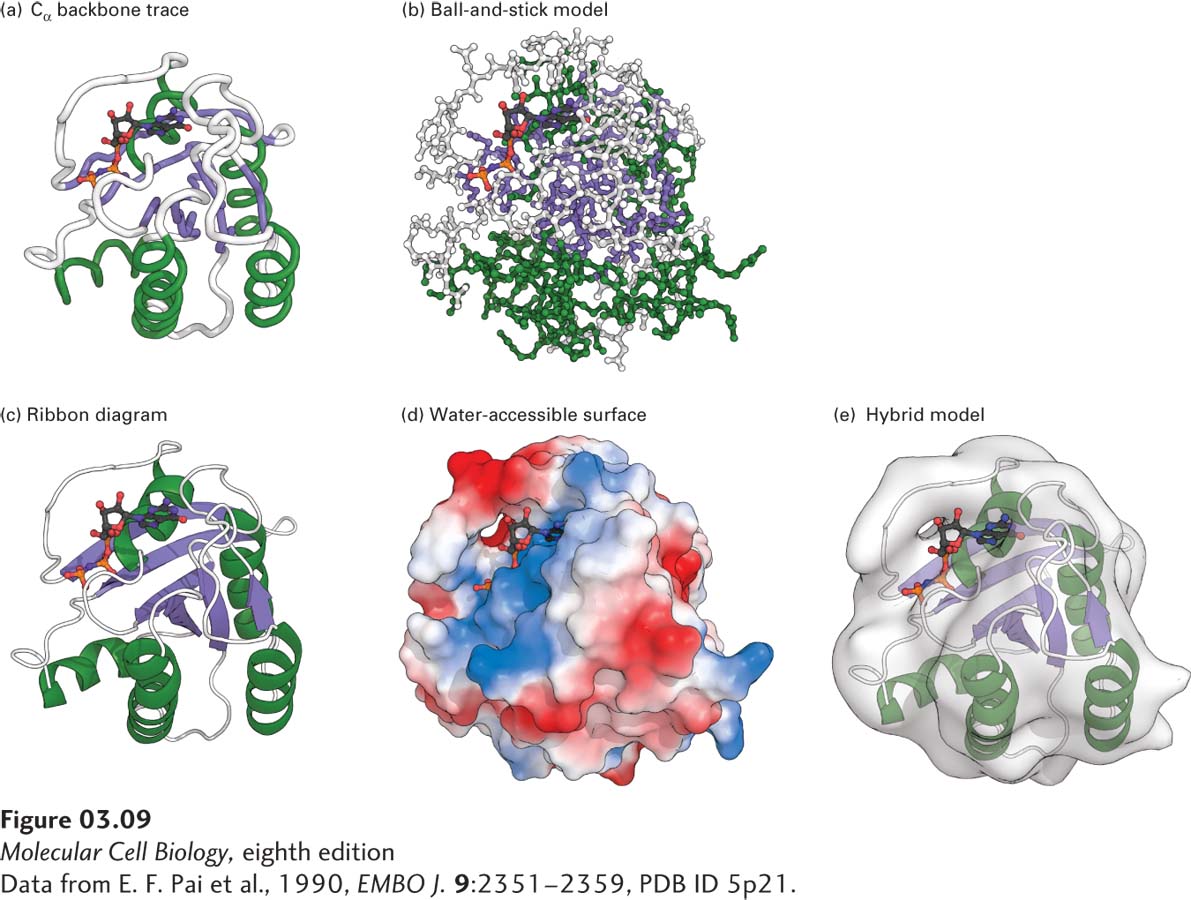
The simplest way to represent three-dimensional protein structure is to trace the course of the backbone atoms, sometimes only the Cα atoms, with a solid line (called a Cα backbone trace, Figure 3-9a); the most complex representation, called a ball-and-stick model, shows every atom (Figure 3-9b). The Cα backbone trace shows the overall folding of the polypeptide chain without consideration of the amino acid side chains; the ball-and-stick model (with balls representing atoms and sticks representing bonds) details the interactions between side-chain atoms, including those that stabilize the protein’s conformation and interact with other molecules, as well as the atoms of the backbone. Even though both views are useful, the elements of secondary structure are not always easily discerned in them. Another type of representation, called a ribbon diagram, uses common shorthand symbols for depicting secondary structure—for example, coiled ribbons or solid cylinders for α helices, flat ribbons or arrows for β strands, and flexible thin strands for β turns, coils, and loops (Figure 3-9c). In a variation of the basic ribbon diagram, ball-and-stick or space-filling models of all or only a subset of side chains can be attached to the backbone ribbon. In this way, side chains that are of interest can be visualized in the context of the secondary structure that is especially clearly represented by the ribbons.
[Data from E. F. Pai et al., 1990, EMBO J.9:2351–2359, PDB ID 5p21.]
FIGURE 3-9Five ways to visualize the protein Ras with its bound GDP. (a) The Cα backbone trace demonstrates how the polypeptide is tightly packed into a small volume. (b) A ball-and-stick representation reveals the locations of all atoms. (c) Turns and loops connect pairs of helices and strands. (d) A water-accessible surface reveals the numerous lumps, bumps, and crevices on the protein surface. Regions of positive charge are shaded purple; regions of negative charge are shaded red. (e) Hybrid model in which ribbon and transparent surface models are combined.
[Data from E. F. Pai et al., 1990, EMBO J.9:2351–2359, PDB ID 5p21.]
However, none of these three ways of representing protein structure conveys much information about the atoms that are on the protein’s surface and in contact with the watery environment. The surface is of interest because it is where other molecules usually bind to a protein. Thus a useful alternative way to represent proteins is to show only the water-accessible surface and use colors to highlight regions having a common chemical character, such as hydrophobicity or hydrophilicity, and charge characteristics, such as positive (basic) or negative (acidic) side chains (Figure 3-9d). Such models reveal the topography of the protein surface and the distribution of charge, both important features of binding sites, as well as clefts in the surface where other molecules may bind. This view represents a protein as it is “seen” by another molecule.