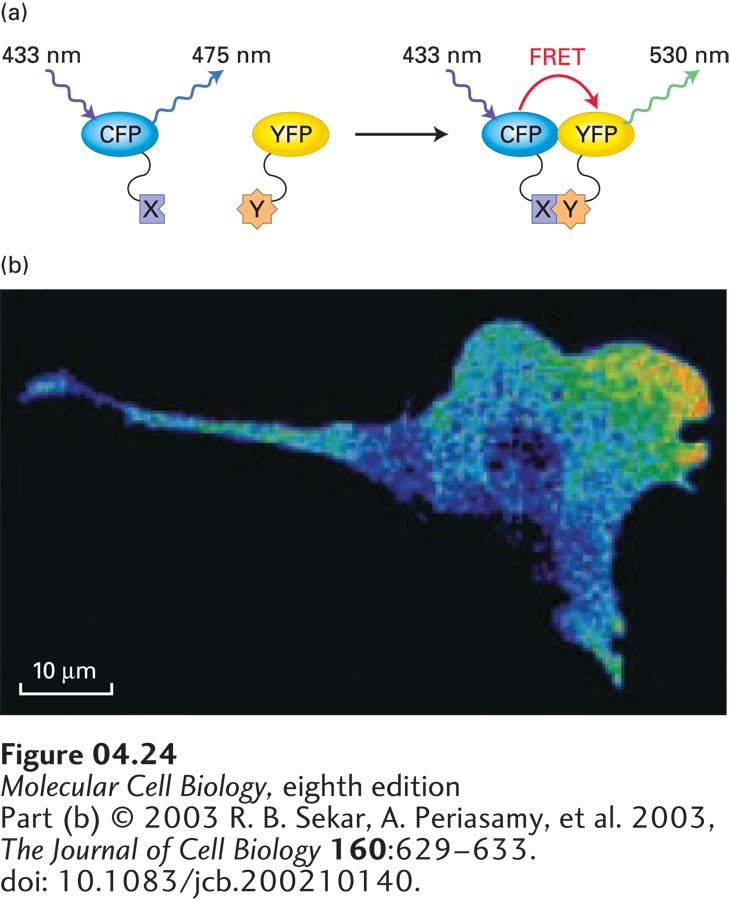
FIGURE 4-24Protein-protein interactions can be visualized by FRET. The idea behind FRET is to use two different fluorescent proteins so that when one is excited, energy will be transferred to the second one by FRET, provided that they are sufficiently close. (a) In this example, cyan fluorescent protein (CFP) is fused to protein X, yellow fluorescent protein (YFP) is fused to protein Y, and both proteins are expressed in a live cell. If the cell is now illuminated with 433-nm light, the CFP will emit a fluorescent signal at 475 nm. If YFP is not close by (left), energy transfer will not occur, and no 530-nm light will be emitted. However, if protein X interacts with protein Y (right), it will bring CFP close to YFP, energy will be transferred to YFP by FRET, and YFP will emit light at 530 nm. (b) In this mouse fibroblast, FRET has been used to reveal that the interaction between an active regulatory protein (Rac) and its binding partner is localized to the front of the migrating cell.
Fluorescence microscopy can also be used to determine if two proteins interact in vivo by taking advantage of a phenomenon called Förster resonance energy transfer (FRET). This technique uses a pair of fluorescent proteins in which the emission wavelength of the first is close to the excitation wavelength of the second (Figure 4-24). For example, when cyan fluorescent protein (CFP) is excited with 433-nm light, it fluoresces and emits light at 475 nm. If yellow fluorescent protein (YFP) is close by, however, instead of emitting 475-nm light, CFP transfers energy to YFP by FRET, and YFP emits light at 530 nm. The efficiency of FRET is proportional to R−6, where R is the distance between the fluorochromes; it is therefore very sensitive to small changes in distance and in practice is not detectable at distances greater than 10 nm. Thus, by illuminating an appropriately prepared sample with 433-nm light and observing at 530 nm, one can tell if proteins separately tagged with CFP and YFP are in very close proximity. For example, FRET sensors have been developed to determine where signaling between a small GTP-binding regulatory protein and its effector occurs in the cell (Figure 4-24b).
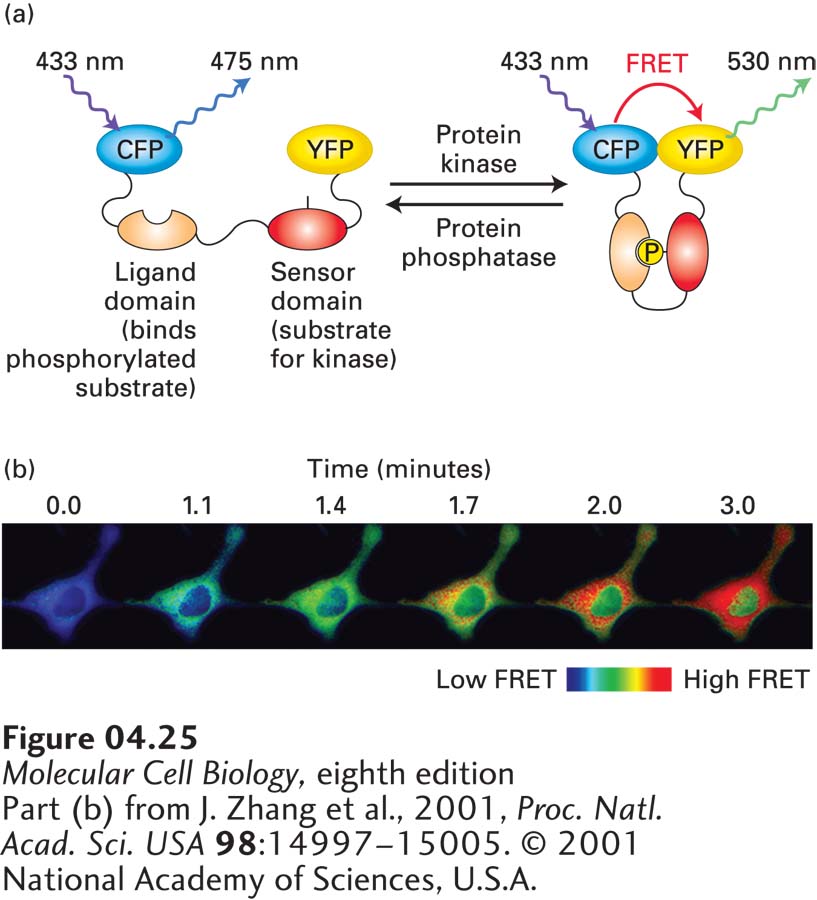
A clever application of FRET, called a FRET biosensor, can be used to sense local biochemical environments in live cells. The idea is to express a single polypeptide containing both CFP and YFP separated by a region that undergoes a conformational change when it senses a biochemical signal. In the absence of the signal, CFP and YFP are too far apart to undergo significant FRET. However, when the signal is detected, the conformational change brings CFP and YFP close enough together to generate FRET. A version of this technique can be used to measure the local activity of a specific protein kinase. In this case, between the CFP and YFP lies a region of polypeptide containing the substrate for the protein kinase—the sensor domain—and a domain that binds specifically to the phosphorylated substrate—the ligand domain (Figure 4-25a). When the sensor domain is phosphorylated by the kinase, the ligand domain binds to it and brings the CFP and YFP sufficiently close to undergo FRET. Since protein phosphorylation is a dynamic process, dephosphorylation of the sensor domain by the appropriate phosphatase will deactivate the FRET biosensor. Thus the FRET signal will reflect the regions of the cell where there is excess kinase over phosphatase activity. As an example, scientists have developed a FRET biosensor for protein kinase A activity, which is activated by elevation of the signaling molecule cAMP (see Section 15.1). In cells expressing the protein kinase A biosensor, pharmacological elevation of cAMP induces rapid FRET (Figure 4-25b). Creative researchers are developing FRET biosensors to illuminate many different types of local environments; for example, FRET biosensors exist to measure the concentration and location of Ca2+ and the activation state of GTPase switch proteins (see Figure 3-32).
EXPERIMENTAL FIGURE 4-25FRET biosensors can detect local biochemical environments. (a) A FRET biosensor is a fusion protein containing two fluorescent proteins linked by a region sensitive to the environment under study. In this example, a protein construct consists of CFP linked to YFP by a region that contains a particular sequence that can be phosphorylated by a specific kinase (the “sensor domain”) and a region (the “ligand domain”) that binds the sensor domain when it is phosphorylated. In the absence of kinase activity, the two fluorescent proteins are too far apart to undergo FRET, whereas when locally phosphorylated by the active kinase, the sensor domain becomes phosphorylated, the ligand domain binds to it, and CFP and YFP are brought sufficiently close to undergo FRET. The sensor can also be deactivated when it encounters the appropriate phosphatase that removes the added phosphate. Thus the biosensor reports on the ratio of kinase to phosphatase activity in the local environment. (b) An example of the use of a FRET biosensor for protein kinase A, which is activated by elevation of cAMP. In this example, forskolin, a drug that induces the generation of cAMP, was added to cells at t = 0 and the images collected at various times thereafter. Imaging shows both the rate of activation and localization of the active kinase.