Cluster Analysis of Multiple Expression Experiments Identifies Co-regulated Genes
Firm conclusions about whether genes that exhibit similar changes in expression are co-regulated, and hence likely to be closely related functionally, rarely can be drawn from a single microarray experiment. For example, many of the observed differences in gene expression just described in fibroblasts could be indirect consequences of the many different changes in cell physiology that occur when cells are transferred from one medium to another. In other words, genes that appear to be co-regulated in a single microarray expression experiment may undergo changes in expression for very different reasons and may actually have very different biological functions. A solution to this problem is to combine the information from a set of microarray expression experiments to find genes that are similarly regulated under a variety of conditions or over a period of time.
Page 249
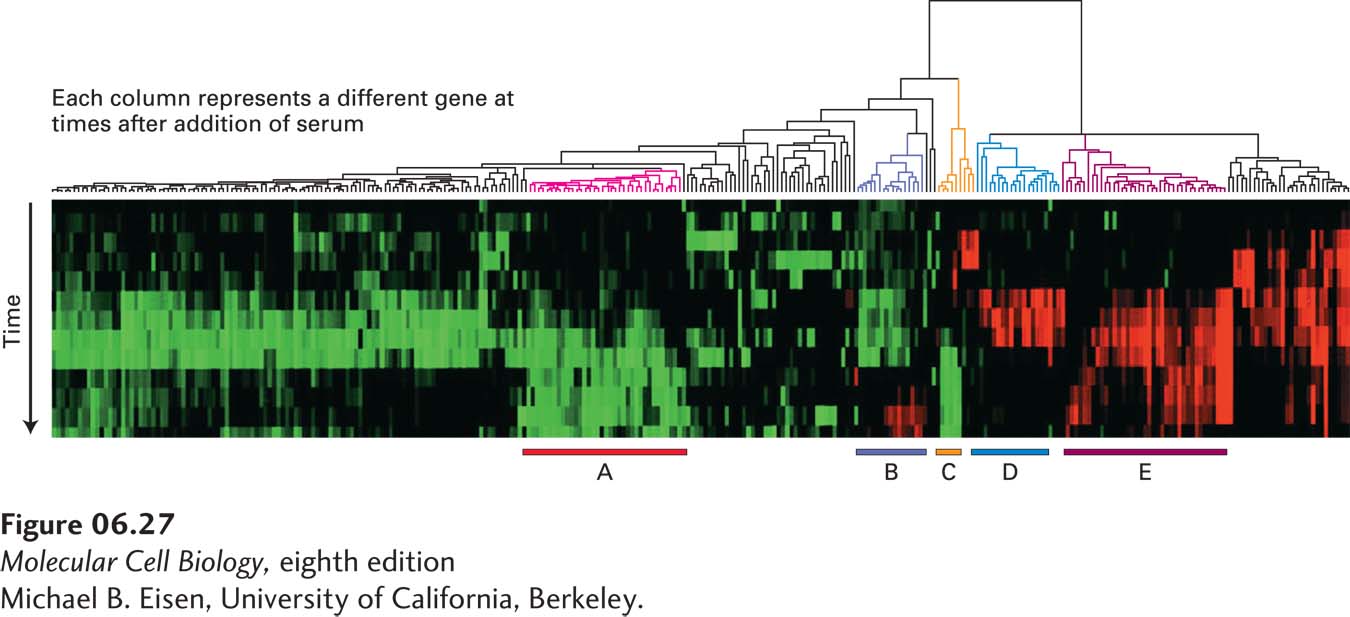
This more informative use of multiple microarray expression experiments is illustrated by an examination of the relative expression of the 8600 genes mentioned above at different times after serum addition to fibroblasts, which generated more than 104 individual pieces of data. A computer program, related to the one used to determine the relatedness of different protein sequences, can organize these data and cluster genes that show similar expression over the time course after serum addition. Remarkably, such cluster analysis groups sets of genes whose encoded proteins participate in a common cellular process, such as cholesterol biosynthesis or the cell cycle (Figure 6-27).
[Michael B. Eisen, University of California, Berkeley.]
EXPERIMENTAL FIGURE 6-27Cluster analysis of data from multiple microarray expression experiments can identify co-regulated genes. The expression of 8600 mammalian genes was detected by microarray analysis at time intervals over a 24-hour period after serum-starved fibroblasts were provided with serum. The cluster diagram shown here is based on a computer algorithm that groups genes showing similar changes in expression compared with a serum-starved control sample over time. Each column of colored boxes represents a single gene, and each row represents a time point. A red box indicates an increase in expression relative to the control; a green box, a decrease in expression; and a black box, no significant change in expression. The “tree” diagram at the top shows how the expression patterns for individual genes can be organized in a hierarchical fashion to group together the genes with the greatest similarity in their patterns of expression over time. Five clusters of coordinately regulated genes were identified in this experiment, as indicated by the bars at the bottom. Each cluster contains multiple genes whose encoded proteins function in a particular cellular process: cholesterol biosynthesis (A), the cell cycle (B), the immediate-early response (C), signaling and angiogenesis (D), and wound healing and tissue remodeling (E).
[Michael B. Eisen, University of California, Berkeley.]
Microarray analysis is a powerful diagnostic tool in medicine. For instance, particular sets of mRNAs have been found to distinguish tumors with a poor prognosis from those with a good prognosis. Previously indistinguishable disease variations are now detectable. Analysis of tumor biopsies for these distinguishing mRNAs will help physicians to select the most appropriate treatment. As more patterns of gene expression characteristic of various diseased tissues are recognized, the diagnostic use of DNA microarrays will be extended to other conditions.