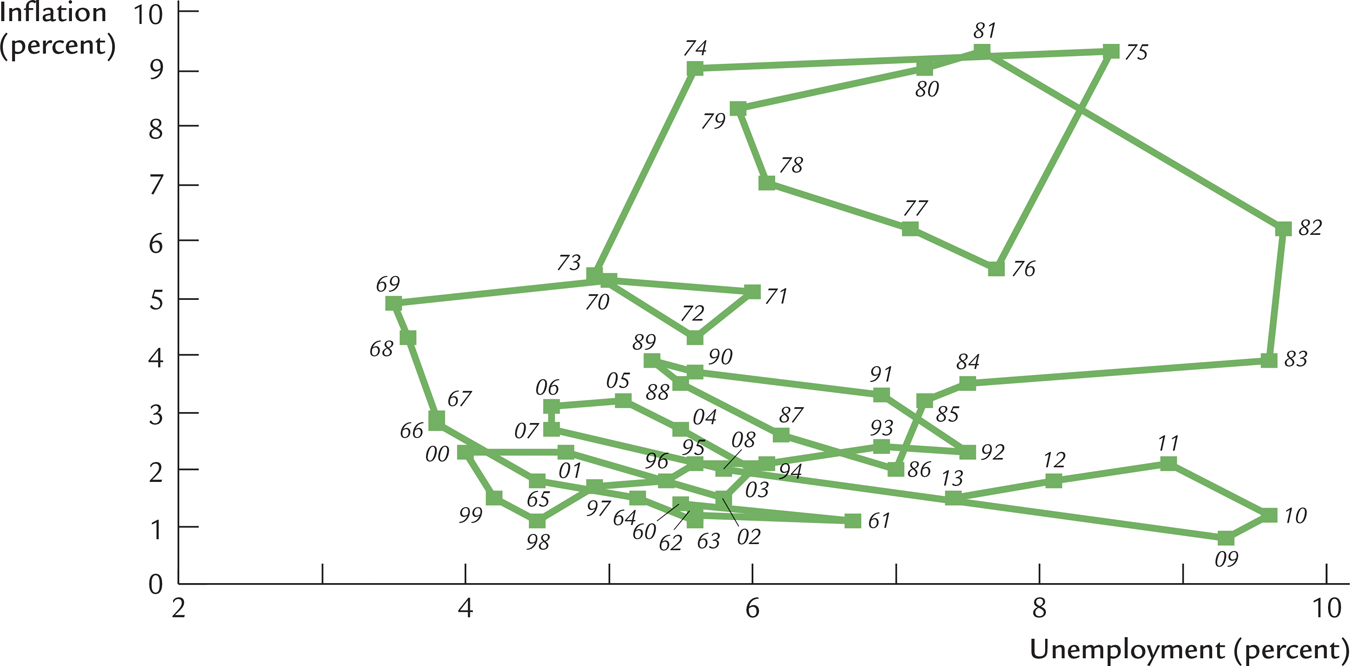
FIGURE 14-3

FIGURE 14- 3: Inflation and Unemployment in the United States, 1960– 2013 This figure uses annual data on the unemployment rate and the inflation rate (percentage change in the GDP deflator) to illustrate macroeconomic developments spanning half a century of U.S. history.
Data from: U.S. Department of Commerce and U.S. Department of Labor.
[Leave] [Close]