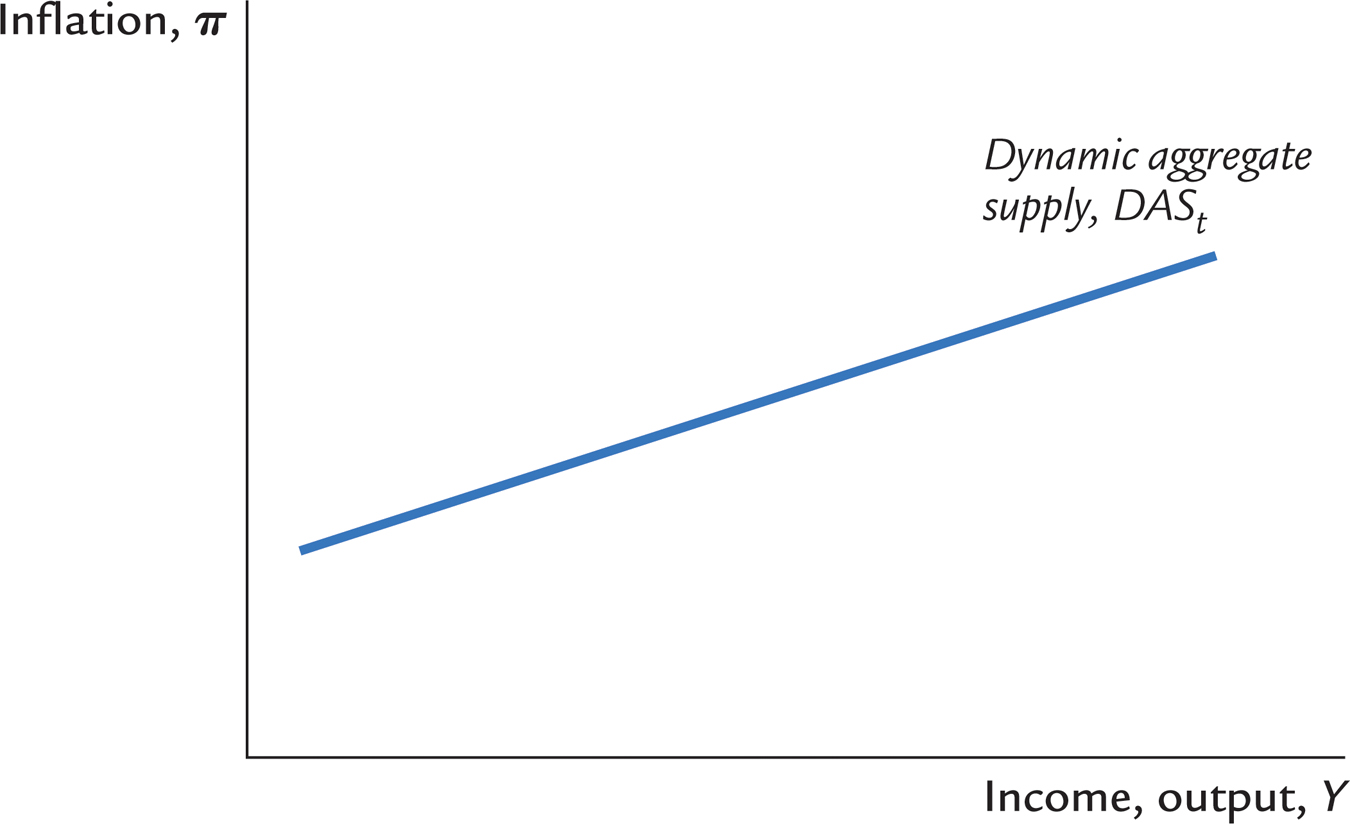
FIGURE 15-2

FIGURE 15- 2: The Dynamic Aggregate Supply Curve The dynamic aggregate supply curve DASt shows a positive association between output Yt and inflation πt. Its upward slope reflects the Phillips curve relationship: other things equal, high levels of economic activity are associated with high inflation. The dynamic aggregate supply curve is drawn for given values of past inflation πt−1, the natural level of output  , and the supply shock υt. When these variables change, the curve shifts.
 , and the supply shock υt. When these variables change, the curve shifts.
[Leave] [Close]