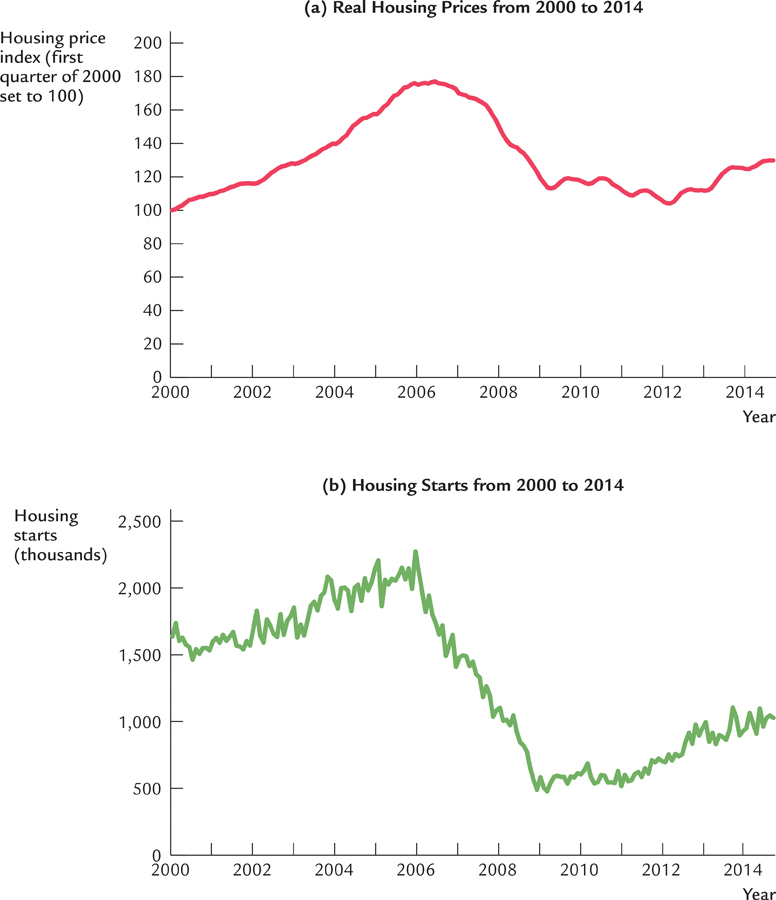
FIGURE 17-7

FIGURE 17- 7: The Housing Market from 2000 to 2014 The first decade of the twenty- first century began with a boom in the housing market, followed by a bust. Panel (a) shows an index of housing prices. Panel (b) shows housing starts— the number of new houses on which builders began construction.
Data from: House prices are the seasonally adjusted prices from the S&P/Case– Shiller20- City Composite Home Price Index, adjusted for inflation using the GDP deflator. Housing starts are from the U.S. Department of Commerce.
[Leave] [Close]