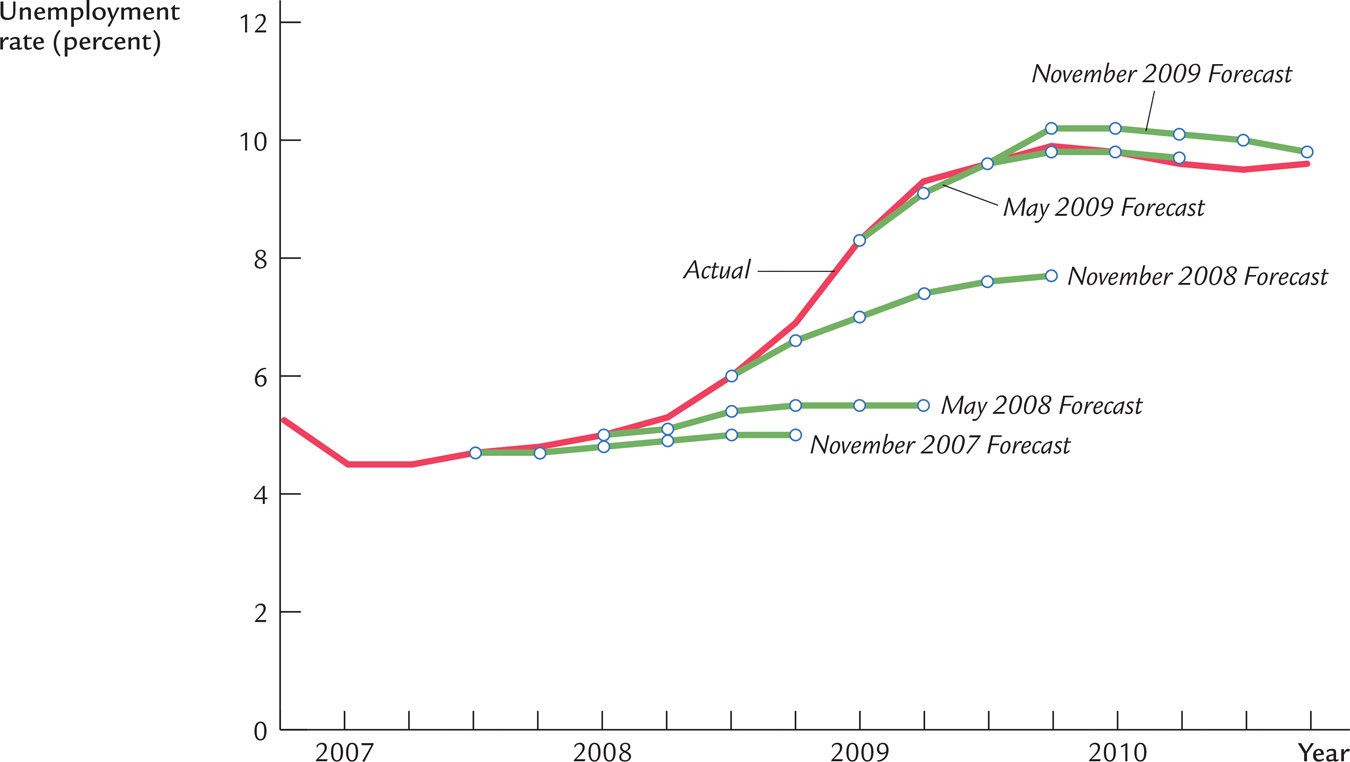
FIGURE 18-1

FIGURE 18- 1: The Failure of Forecasting During the Great Recession The red line shows the actual unemployment rate from 2007 to 2010. The green lines show the unemployment rate predicted at various points in time. For each forecast, the symbols mark the current unemployment rate and the forecast for the subsequent five quarters. Note that the forecasters failed to predict the substantial rise in the unemployment rate.
Data from: The unemployment rate is from the U.S. Department of Labor. The predicted unemployment rate is the median forecast in the Survey of Professional Forecasters.
[Leave] [Close]