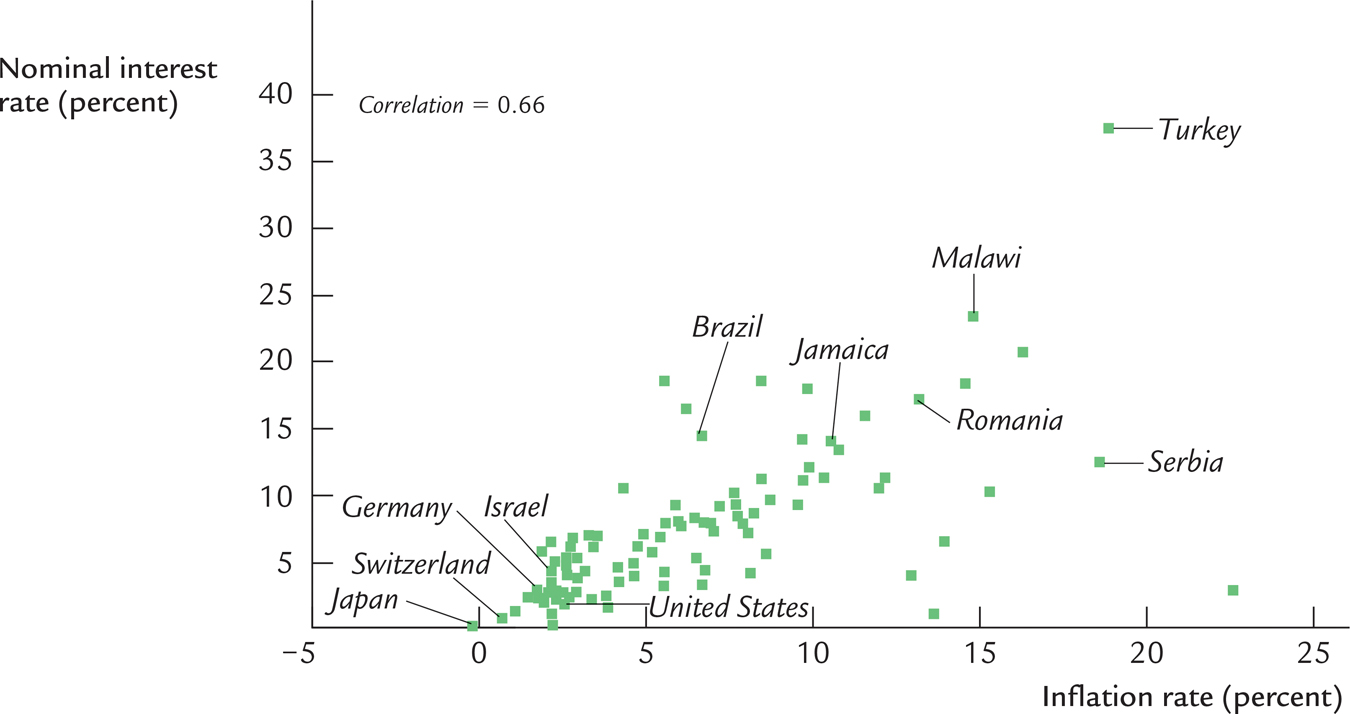
FIGURE 5-4

FIGURE 5- 4: Inflation and Nominal Interest Rates Across Countries This scatterplot shows the average nominal interest rate on short- term Treasury bills and the average inflation rate in 100 countries during the period 2000 to 2013. The positive correlation between the inflation rate and the nominal interest rate is evidence for the Fisher effect.
Data from: International Monetary Fund.
[Leave] [Close]