PROBLEMS AND APPLICATIONS
For any problem marked with  , there is a Work It Out online tutorial available for a similar problem. To access these interactive, step-
Question 12.5
1. According to the IS–LM model, what happens in the short run to the interest rate, income, consumption, and investment under the following circumstances? Be sure your answer includes an appropriate graph.
The central bank increases the money supply.
The government increases government purchases.
The government increases taxes.
The government increases government purchases and taxes by equal amounts.
Question 12.6
2. Use the IS–LM model to predict the short-
363
After the invention of a new high-
speed computer chip, many firms decide to upgrade their computer systems. A wave of credit card fraud increases the frequency with which people make transactions in cash.
A best-
seller titled Retire Rich convinces the public to increase the percentage of their income devoted to saving. The appointment of a new “dovish” Federal Reserve chair increases expected inflation.
Question 12.7
3.
• Consider the economy of Hicksonia.
The consumption function is given by
C = 300 + 0.6(Y − T).
The investment function is
I = 700 − 80r.
Government purchases and taxes are both 500. For this economy, graph the IS curve for r ranging from 0 to 8.
The money demand function in Hicksonia is
(M/P)d = Y − 200r.
The money supply M is 3,000 and the price level P is 3. Graph the LM curve for r ranging from 0 to 8.
Find the equilibrium interest rate r and the equilibrium level of income Y.
Suppose that government purchases are increased from 500 to 700. How does the IS curve shift? What are the new equilibrium interest rate and level of income?
Suppose instead that the money supply is increased from 3,000 to 4,500. How does the LM curve shift? What are the new equilibrium interest rate and level of income?
With the initial values for monetary and fiscal policy, suppose that the price level rises from 3 to 5. What happens? What are the new equilibrium interest rate and level of income?
For the initial value of monetary and fiscal policy, derive and graph an equation for the aggregate demand curve. What happens to this aggregate demand curve if fiscal or monetary policy changes, as in parts (d) and (e)?
Question 12.8
4.
• An economy is initially described by the following equations:
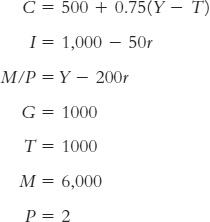
Derive and graph the IS curve and the LM curve. Calculate the equilibrium interest rate and level of income. Label that point A on your graph.
Suppose that a newly elected president cuts taxes by 20 percent. Assuming the money supply is held constant, what are the new equilibrium interest rate and level of income? What is the tax multiplier?
Now assume that the central bank adjusts the money supply to hold the interest rate constant. What is the new level of income? What must the new money supply be? What is the tax multiplier?
Now assume that the central bank adjusts the money supply to hold the level of income constant. What is the new equilibrium interest rate? What must the money supply be? What is the tax multiplier?
Show the equilibria you calculated in parts (b), (c), and (d) on the graph you drew in part (a). Label them points B, C, and D.
Question 12.9
5. Determine whether each of the following statements is true or false, and explain why. For each true statement, discuss whether there is anything unusual about the impact of monetary and fiscal policy in that special case.
If investment does not depend on the interest rate, the LM curve is horizontal.
364
If investment does not depend on the interest rate, the IS curve is vertical.
If money demand does not depend on the interest rate, the IS curve is horizontal.
If money demand does not depend on the interest rate, the LM curve is vertical.
If money demand does not depend on income, the LM curve is horizontal.
If money demand is extremely sensitive to the interest rate, the LM curve is horizontal.
Question 12.10
6. Monetary policy and fiscal policy often change at the same time.
Suppose that the government wants to raise investment but keep output constant. In the IS–LM model, what mix of monetary and fiscal policy will achieve this goal?
In the early 1980s, the U.S. government cut taxes and ran a budget deficit while the Fed pursued a tight monetary policy. What effect should this policy mix have?
Question 12.11
7. Use the IS–LM diagram to describe both the short-
An increase in the money supply
An increase in government purchases
An increase in taxes
Question 12.12
8. The Fed is considering two alternative monetary policies:
holding the money supply constant and letting the interest rate adjust, or
adjusting the money supply to hold the interest rate constant.
In the IS–LM model, which policy will better stabilize output under the following conditions? Explain your answer.
All shocks to the economy arise from exogenous changes in the demand for goods and services.
All shocks to the economy arise from exogenous changes in the demand for money.
Question 12.13
9. Suppose that the demand for real money balances depends on disposable income. That is, the money demand function is
M/P = L(r, Y − T).
Using the IS–LM model, discuss whether this change in the money demand function alters the following.
The analysis of changes in government purchases
The analysis of changes in taxes
Question 12.14
10. This problem asks you to analyze the IS–LM model algebraically. Suppose consumption is a linear function of disposable income:
C(Y − T) = a + b(Y − T),
where a > 0 and 0 < b < 1. The parameter b is the marginal propensity to consume, and the parameter a is a constant sometimes called autonomous consumption. Suppose also that investment is a linear function of the interest rate:
I(r) = c − dr,
where c > 0 and d > 0. The parameter d measures the sensitivity of investment to the interest rate, and the parameter c is a constant sometimes called autonomous investment.
Solve for Y as a function of r, the exogenous variables G and T, and the model’s parameters a, b, c, and d.
How does the slope of the IS curve depend on the parameter d, the interest sensitivity of investment? Refer to your answer to part (a), and explain the intuition.
Which will cause a bigger horizontal shift in the IS curve, a $100 tax cut or a $100 increase in government spending? Refer to your answer to part (a), and explain the intuition.
Now suppose demand for real money balances is a linear function of income and the interest rate:
L(r, Y) = eY − fr,
365
where e > 0 and f > 0. The parameter e measures the sensitivity of money demand to income, while the parameter f measures the sensitivity of money demand to the interest rate.
Solve for r as a function of Y, M, and P and the parameters e and f.
Using your answer to part (d), determine whether the LM curve is steeper for large or small values of f, and explain the intuition.
How does the size of the shift in the LM curve resulting from a $100 increase in M depend on
the value of the parameter e, the income sensitivity of money demand?
the value of the parameter f, the interest sensitivity of money demand?
Use your answers to parts (a) and (d) to derive an expression for the aggregate demand curve. Your expression should show Y as a function of P; of exogenous policy variables M, G, and T; and of the model’s parameters. This expression should not contain r.
Use your answer to part (g) to prove that the aggregate demand curve has a negative slope.
Use your answer to part (g) to prove that increases in G and M, and decreases in T, shift the aggregate demand curve to the right. How does this result change if the parameter f, the interest sensitivity of money demand, equals zero? Explain the intuition for your result.
1 For a flavor of the debate, see Milton Friedman and Anna J. Schwartz, A Monetary History of the United States, 1867–
2 Ben Bernanke, “Non-
3 E. Cary Brown, “Fiscal Policy in the Thirties: A Reappraisal,” American Economic Review 46 (December 1956): 857–
4 We discussed the reasons for this large decrease in the money supply in Chapter 4, where we examined the money supply process in more detail. In particular, see the Case Study on Bank Failures and the Money Supply in the 1930s.
5 To read more about the liquidity trap, see Paul R. Krugman, “It’s Baaack: Japan’s Slump and the Return of the Liquidity Trap,” Brookings Panel on Economic Activity 1998, no. 2: 137–
366