APPENDIXA Short-Run Model of the Large Open Economy
When analyzing policies in an economy such as that of the United States, we need to combine the closed-economy logic of the IS–LM model and the small-open-economy logic of the Mundell–Fleming model. This appendix presents a model for the intermediate case of a large open economy.
As we discussed in the appendix to Chapter 6, a large open economy differs from a small open economy because its interest rate is not fixed by world financial markets. In a large open economy, we must consider the relationship between the interest rate and the flow of capital abroad. The net capital outflow is the amount that domestic investors lend abroad minus the amount that foreign investors lend here. As the domestic interest rate falls, domestic investors find foreign lending more attractive, and foreign investors find lending here less attractive. Thus, the net capital outflow is negatively related to the interest rate. Here we add this relationship to our short-run model of national income.
The three equations of the model are
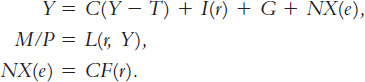
The first two equations are the same as those used in the Mundell–Fleming model of this chapter. The third equation, taken from the appendix to Chapter 6, states that the trade balance NX equals the net capital outflow CF, which in turn depends on the domestic interest rate.
To see what this model implies, substitute the third equation into the first, so the model becomes
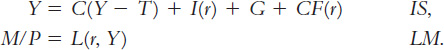
These two equations are much like the two equations of the closed-economy IS–LM model. The only difference is that expenditure now depends on the interest rate for two reasons. As before, a higher interest rate reduces investment. But now a higher interest rate also reduces the net capital outflow and thus lowers net exports.
To analyze this model, we can use the three graphs in Figure 13-15. Panel (a) shows the IS–LM diagram. As in the closed-economy model in Chapter 11 and Chapter 12, the interest rate r is on the vertical axis, and income Y is on the horizontal axis. The IS and LM curves together determine the equilibrium level of income and the equilibrium interest rate.
FIGURE 13-15

403
The new net-capital-outflow term in the IS equation, CF(r), makes this IS curve flatter than it would be in a closed economy. The more responsive international capital flows are to the interest rate, the flatter the IS curve is. You might recall from the Chapter 6 appendix that the small open economy represents the extreme case in which the net capital outflow is infinitely elastic at the world interest rate. In this extreme case, the IS curve is completely flat. Hence, a small open economy would be depicted in this figure with a horizontal IS curve.
Panels (b) and (c) show how the equilibrium from the IS–LM model determines the net capital outflow, the trade balance, and the exchange rate. In panel (b) we see that the interest rate determines the net capital outflow. This curve slopes downward because a higher interest rate discourages domestic investors from lending abroad and encourages foreign investors to lend here, thereby reducing the net capital outflow. In panel (c) we see that the exchange rate adjusts to ensure that net exports of goods and services equal the net capital outflow.
Now let’s use this model to examine the impact of various policies. We assume that the economy has a floating exchange rate because this assumption is correct for most large open economies such as that of the United States.
404
Fiscal Policy
Figure 13-16 examines the impact of a fiscal expansion. An increase in government purchases or a cut in taxes shifts the IS curve to the right. As panel (a) illustrates, this shift in the IS curve leads to an increase in the level of income and an increase in the interest rate. These two effects are similar to those in a closed economy.
FIGURE 13-16

Yet in the large open economy the higher interest rate reduces the net capital outflow, as in panel (b). The fall in the net capital outflow reduces the supply of dollars in the market for foreign exchange. The exchange rate appreciates, as in panel (c). Because domestic goods become more expensive relative to foreign goods, net exports fall.
Figure 13-16 shows that a fiscal expansion does raise income in the large open economy, unlike in a small open economy under a floating exchange rate. The impact on income, however, is smaller than in a closed economy. In a closed economy, the expansionary impact of fiscal policy is partially offset by the crowding out of investment: as the interest rate rises, investment falls, reducing the fiscal-policy multipliers. In a large open economy, there is yet another offsetting factor: as the interest rate rises, the net capital outflow falls, the currency appreciates in the foreign-exchange market, and net exports fall. This reduces the fiscal-policy multiplier even further. (In the figure, this additional channel is manifested by the flatter IS curve mentioned earlier: for any given rightward shift in the IS curve, a flatter curve implies a smaller expansion in income.) Together these effects are not large enough to make fiscal policy powerless, as it is in a small open economy, but they do reduce the impact of fiscal policy.
405
Monetary Policy
Figure 13-17 examines the effect of a monetary expansion. An increase in the money supply shifts the LM curve to the right, as in panel (a). The level of income rises, and the interest rate falls. Once again, these effects are similar to those in a closed economy.
FIGURE 13-17

Yet, as panel (b) shows, the lower interest rate leads to a higher net capital outflow. The increase in CF raises the supply of dollars in the market for foreign exchange. The exchange rate falls, as in panel (c). As domestic goods become cheaper relative to foreign goods, net exports rise.
406
We can now see that the monetary transmission mechanism works through two channels in a large open economy. As in a closed economy, a monetary expansion lowers the interest rate, which stimulates investment. As in a small open economy, a monetary expansion causes the currency to depreciate in the market for foreign exchange, which stimulates net exports. Both effects result in a higher level of aggregate income. Indeed, because the IS curve is flatter here than it is in a closed economy, any given shift in the LM curve will have a larger impact on income.
A Rule of Thumb
This model of the large open economy describes well the U.S. economy today. Yet it is somewhat more complicated and cumbersome than the model of the closed economy we studied in Chapter 11 and Chapter 12 and the model of the small open economy we developed in this chapter. Fortunately, there is a useful rule of thumb to help you determine how policies influence a large open economy without remembering all the details of the model: The large open economy is an average of the closed economy and the small open economy. To find how any policy will affect any variable, find the answer in the two extreme cases and take an average.
For example, how does a monetary contraction affect the interest rate and investment in the short run? In a closed economy, the interest rate rises, and investment falls. In a small open economy, neither the interest rate nor investment changes. The effect in the large open economy is an average of these two cases: a monetary contraction raises the interest rate and reduces investment, but only somewhat. The fall in the net capital outflow mitigates the rise in the interest rate and the fall in investment that would occur in a closed economy. But unlike in a small open economy, the international flow of capital is not so strong as to fully negate these effects.
This rule of thumb makes the simple models all the more valuable. Although they do not describe perfectly the world in which we live, they do provide a useful guide to the effects of economic policy.