19-1 The Size of the Government Debt
Let’s begin by putting the government debt in perspective. In 2014, the debt of the U.S. federal government was $12.9 trillion. If we divide this number by 316 million, the number of people in the United States, we find that each person’s share of the government debt was about $41,000. Obviously, this is not a trivial number; few people sneeze at $41,000. Yet if we compare this debt to the roughly $2 million a typical person will earn over his working life, the government debt does not look like the catastrophe it is sometimes made out to be.
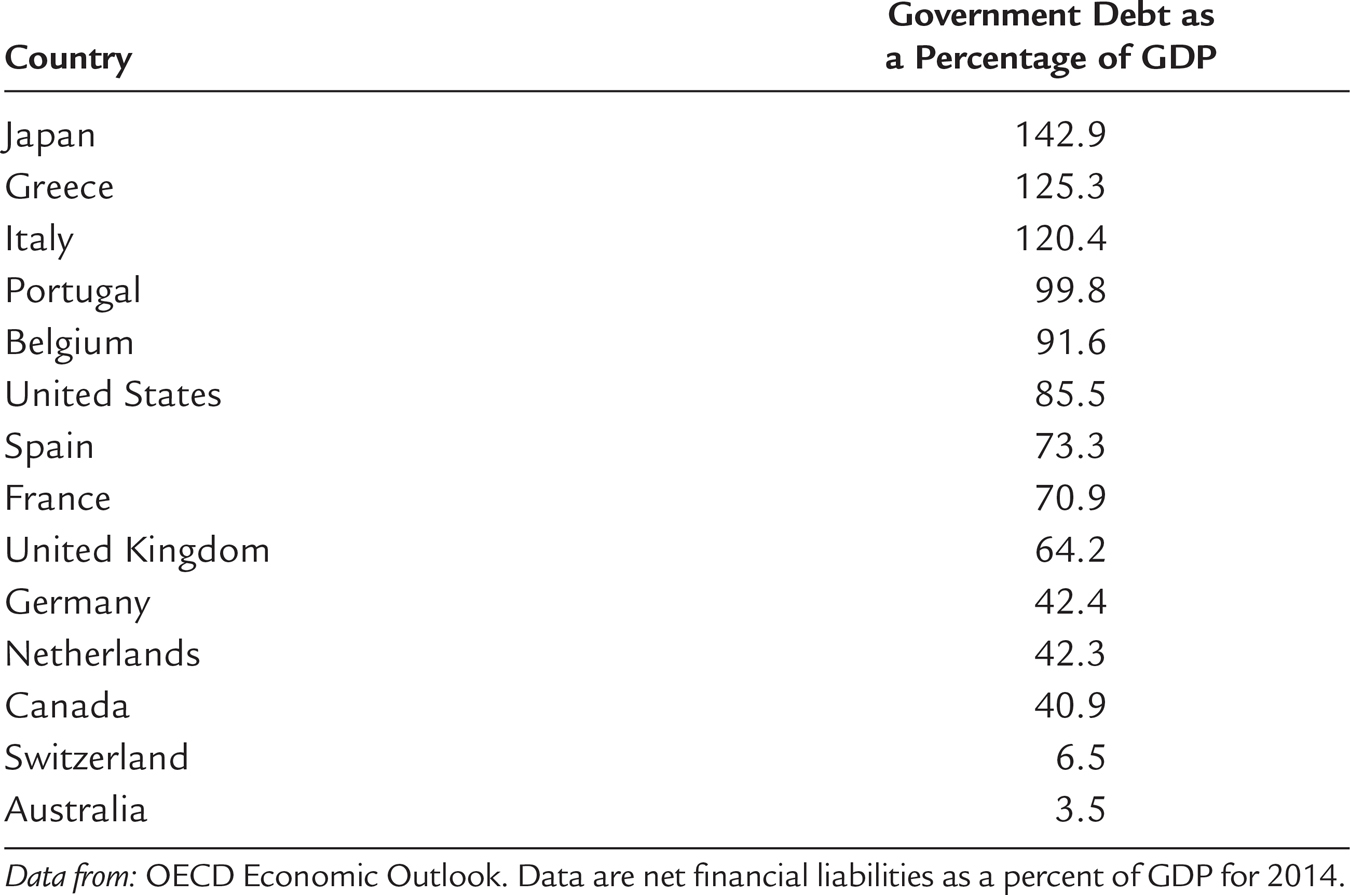
One way to judge the size of a government’s debt is to compare it to the amount of debt other countries have accumulated. Table 19-1 shows the amount of government debt for several major countries expressed as a percentage of each country’s GDP. The figure here is net debt: the government’s financial obligations less any financial assets that it holds. At the top of the list are the heavily indebted countries of Japan, Greece, and Italy, which have accumulated a debt that exceeds annual GDP. At the bottom are Switzerland and Australia, which have accumulated relatively small debts. The United States is more indebted than average, but it is not far from the middle of the pack. By international standards, the U.S. government is neither especially profligate nor especially frugal.
TABLE 19-1
TABLE 19-1: How Indebted are the World’s Governments?

557
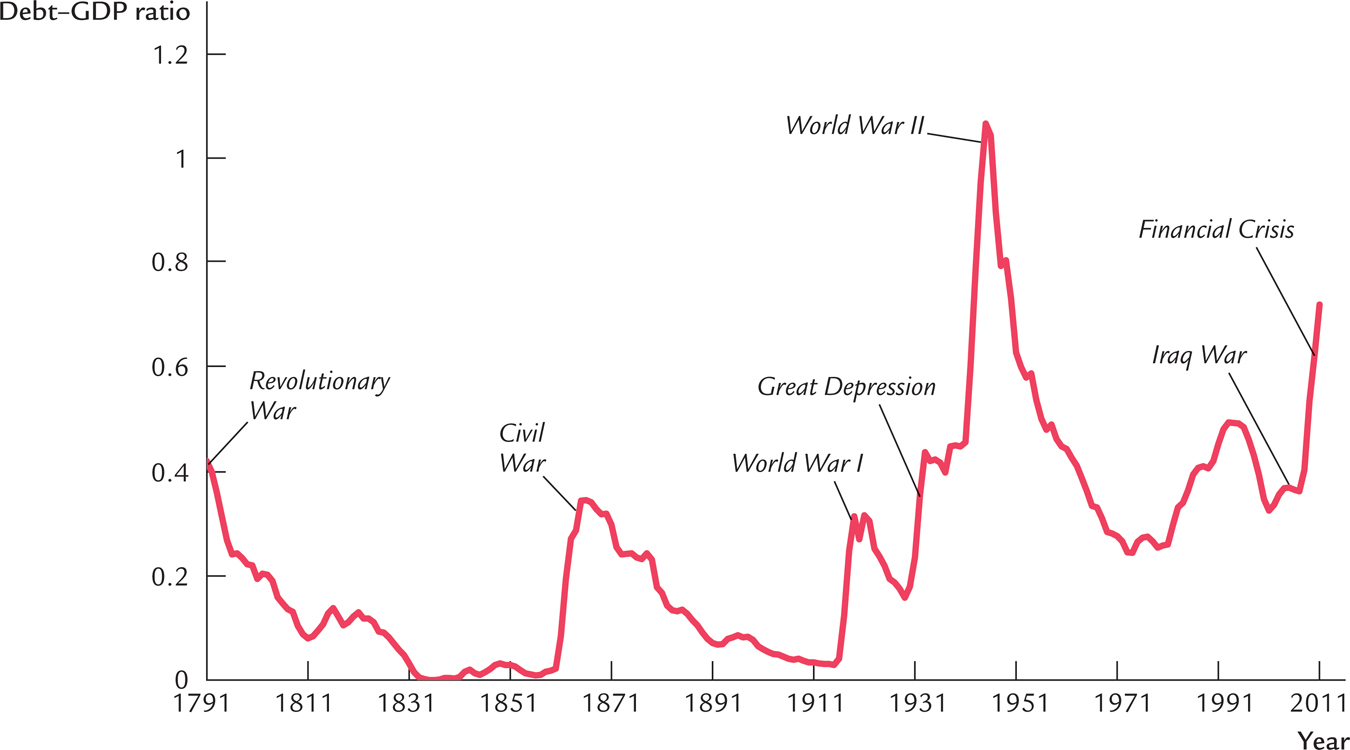
Over the course of U.S. history, the indebtedness of the federal government has varied substantially. Figure 19-1 shows the ratio of the federal debt to GDP since 1791. The government debt, relative to the size of the economy, varies from close to zero in the 1830s to a maximum of 106 percent of GDP in 1946.
FIGURE 19-1

Historically, the primary cause of increases in the government debt is war. The debt–GDP ratio rises sharply during major wars and falls slowly during peacetime. Many economists think that this historical pattern is the appropriate way to run fiscal policy. As we will discuss more fully later in this chapter, deficit financing of wars appears optimal for reasons of both tax smoothing and generational equity.
One instance of a large increase in government debt in peacetime began in the early 1980s. When Ronald Reagan was elected president in 1980, he was committed to reducing taxes and increasing military spending. These policies, coupled with a deep recession attributable to tight monetary policy, began a long period of substantial budget deficits. The government debt expressed as a percentage of GDP roughly doubled from 25 percent in 1980 to 47 percent in 1995. The United States had never before experienced such a large increase in government debt during a period of peace and prosperity. Many economists have criticized this increase in government debt as imposing an unjustifiable burden on future generations.
558
The increase in government debt during the 1980s caused significant concern among many policymakers as well. In 1990, President George H. W. Bush raised taxes to reduce the deficit, breaking his “Read my lips: No new taxes” campaign pledge and, according to some political commentators, costing him reelection. In 1993, when President Bill Clinton took office, he raised taxes yet again. These tax increases, together with spending restraint and rapid economic growth due to the information-technology boom, caused the budget deficits to shrink and eventually turn into budget surpluses. The government debt fell from 47 percent of GDP in 1995 to 31 percent in 2001.
When President George W. Bush took office in 2001, the high-tech boom in the stock market was reversing course, and the economy was heading into recession. Economic downturns automatically cause tax revenue to fall and push the budget toward deficit. In addition, tax cuts to combat the recession and increased spending for homeland security and wars in Afghanistan and Iraq further increased the budget deficit, which averaged about 2 percent of GDP during his tenure. From 2001 to 2008, government debt rose from 31 to 39 percent of GDP.
559
When President Barack Obama moved into the White House in 2009, the economy was in the midst of a deep recession following a financial crisis. Tax revenues were declining as the economy shrank. In addition, one of the new president’s first actions was to sign a large fiscal stimulus to prop up the aggregate demand for goods and services. (A Case Study in Chapter 11 examines this policy.) The federal government’s budget deficit was 10 percent of GDP in 2009, 9 percent in 2010, and 8 percent in 2011. The debt–GDP ratio rose to 74 percent of GDP by 2014.
These trends led to a significant event in August 2011: Standard & Poor’s, a major private agency that evaluates the safety of bonds, reduced its credit rating on U.S. government debt to one notch below the top AAA grade. For many years, U.S. government debt was considered the safest around. That is, buyers of these bonds could be completely confident that they would be repaid in full when the bond matured. Standard & Poor’s, however, was sufficiently concerned about recent fiscal policy that it raised the possibility that the U.S. government might someday default.
CASE STUDY
The Troubling Long-Term Outlook for Fiscal Policy
Why did Standard & Poor’s downgrade U.S. government debt? The large budget deficits from 2009 to 2011 were one reason but probably not the main one. More important was the longer-term outlook for fiscal policy. When economists project the path of U.S. fiscal policy over the next several decades, they paint a troubling picture.
One reason is demographic. Advances in medical technology have been increasing life expectancy, while improvements in birth-control techniques and changing social norms have reduced the number of children people have. Because of these developments, the elderly are becoming a larger share of the population. In 1950, the elderly population (aged 65 and older) was about 14 percent the size of the working-age population (aged 20 to 64). Now the elderly are about 21 percent of the working-age population, and that figure will rise to about 40 percent by 2050. About one-third of the federal budget is devoted to providing the elderly with pensions (mainly through the Social Security program) and health care. As more people become eligible for these “entitlements,” as they are sometimes called, government spending will automatically rise over time.
A second, related reason for the troubling fiscal picture is the rising cost of health care. The government provides health care to the elderly through the Medicare system and to the poor through Medicaid. As the cost of health care increases, government spending on these programs increases as well. Policymakers have proposed various ways to stem the rise in health care costs, such as reducing the burden of lawsuits, encouraging more competition among health care providers, and promoting greater use of information technology. The health care reform act signed into law by President Obama in 2009 established a new government agency, called the Independent Payment Advisory Board, to promulgate changes in Medicare to reduce costs. Yet many health economists believe such measures will have only limited impact. A main reason for rising health care costs is medical advances that provide new, better, but often expensive ways to extend and improve our lives.
560
The combination of the aging population and rising health care costs will have a major impact on the federal budget. Government spending on Social Security, Medicare, Medicaid, and other government health care programs has already risen from less than 1 percent of GDP in 1950 to about 10 percent today. The upward trajectory is not about to stop. The Congressional Budget Office estimates that if no changes are made, spending on these programs will rise to 17.5 percent of GDP by 2065 (when today’s college students will have retired).
How the United States will handle these spending pressures is an open question. The key issue is how the required fiscal adjustment will be split between tax increases and spending reductions. Some economists believe that to pay for these commitments, we will need to raise taxes as a percentage of GDP substantially above what it has been historically. Given the projected increases in spending on Social Security, Medicare, and Medicaid, paying for these benefits would require increasing all taxes by more than one-third. Other economists believe that such high tax rates would impose too great a cost on younger workers. They believe that policymakers should reduce the promises now being made to the elderly of the future and that, at the same time, people should be encouraged to take a greater role in providing for themselves as they age. This might entail raising the normal retirement age, while giving people more incentive to save during their working years as preparation for assuming more of their own retirement and health care costs.
Resolving this debate will be one of the great policy challenges in the decades ahead. Neither substantial tax hikes nor substantial spending cuts are politically popular, which is why the problem has not been addressed already. Yet the only alternative is a continuation of large budget deficits and increasing government debt. At some point, as government debt rises as a share of GDP, the government’s ability or willingness to service and repay these debts would be called into question. And that is the main reason that Standard & Poor’s, looking ahead to these formidable challenges, downgraded the credit rating of the U.S. government. They did not say that default was a likely outcome, but they did suggest that it was a possibility. 