1-1 What Macroeconomists Study
Why have some countries experienced rapid growth in incomes over the past century while others have stayed mired in poverty? Why do some countries have high rates of inflation while others maintain stable prices? Why do all countries experience recessions and depressions—
To appreciate the importance of macroeconomics, you need only head over to some online news Web site. Every day you can see headlines such as INCOME GROWTH REBOUNDS, FED MOVES TO COMBAT INFLATION, or STOCKS FALL AMID RECESSION FEARS. These macroeconomic events may seem abstract, but they touch all of our lives. Business executives forecasting the demand for their products must guess how fast consumers’ incomes will grow. Senior citizens living on fixed incomes wonder how fast prices will rise. Recent college graduates looking for jobs hope that the economy will boom and that firms will be hiring.
2
Because the state of the economy affects everyone, macroeconomic issues play a central role in national political debates. Voters are aware of how the economy is doing, and they know that government policy can affect the economy in powerful ways. As a result, the popularity of an incumbent president often rises when the economy is doing well and falls when it is doing poorly.
Macroeconomic issues are also central to world politics, and the international news is filled with macroeconomic questions. Was it a good move for much of Europe to adopt a common currency? Should China maintain a fixed exchange rate against the U.S. dollar? Why is the United States running large trade deficits? How can poor nations raise their standards of living? When world leaders meet, these topics are often high on their agenda.
Although the job of making economic policy belongs to world leaders, the job of explaining the workings of the economy as a whole falls to macroeconomists. Toward this end, macroeconomists collect data on incomes, prices, unemployment, and many other variables from different time periods and different countries. They then attempt to formulate general theories to explain these data. Like astronomers studying the evolution of stars or biologists studying the evolution of species, macroeconomists cannot conduct controlled experiments in a laboratory. Instead, they must make use of the data that history gives them. Macroeconomists observe that economies differ across countries and that they change over time. These observations provide both the motivation for developing macroeconomic theories and the data for testing them.
To be sure, macroeconomics is an imperfect science. The macroeconomist’s ability to predict the future course of economic events is no better than the meteorologist’s ability to predict next month’s weather. But, as you will see, macroeconomists know quite a lot about how economies work. This knowledge is useful both for explaining economic events and for formulating economic policy.
Every era has its own economic problems. In the 1970s, Presidents Richard Nixon, Gerald Ford, and Jimmy Carter all wrestled in vain with a rising rate of inflation. In the 1980s, inflation subsided, but Presidents Ronald Reagan and George H. W. Bush presided over large federal budget deficits. In the 1990s, with President Bill Clinton in the Oval Office, the economy and stock market enjoyed a remarkable boom, and the federal budget turned from deficit to surplus. As Clinton left office, however, the stock market was in retreat, and the economy was heading into recession. In 2001 President George W. Bush reduced taxes to help end the recession, but the tax cuts contributed to a reemergence of budget deficits.
President Barack Obama moved into the White House in 2009 during a period of heightened economic turbulence. The economy was reeling from a financial crisis, driven by a large drop in housing prices, a steep rise in mortgage defaults, and the bankruptcy or near-
3
Macroeconomic history is not a simple story, but it provides a rich motivation for macroeconomic theory. While the basic principles of macroeconomics do not change from decade to decade, the macroeconomist must apply these principles with flexibility and creativity to meet changing circumstances.
CASE STUDY
The Historical Performance of the U.S. Economy
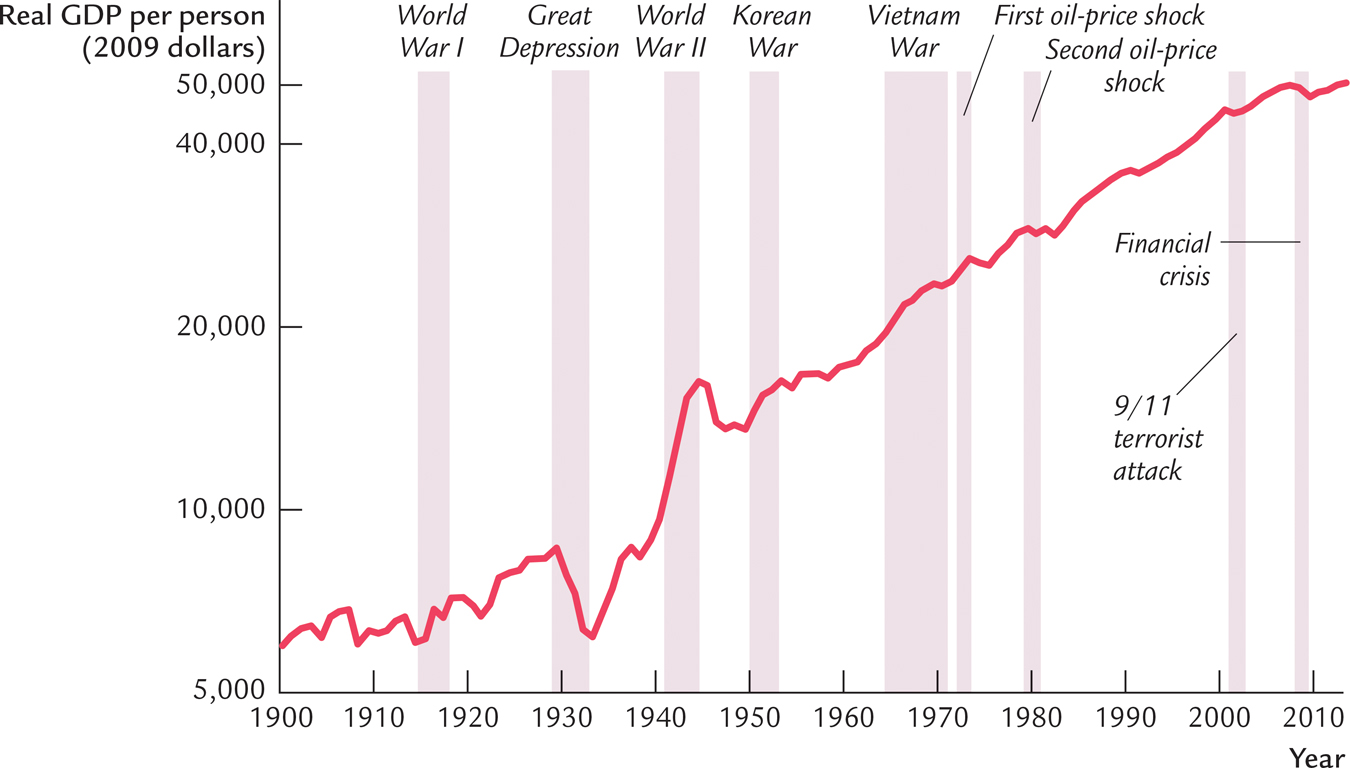
Economists use many types of data to measure the performance of an economy. Three macroeconomic variables are especially important: real gross domestic product (GDP), the inflation rate, and the unemployment rate. Real GDP measures the total income of everyone in the economy (adjusted for the level of prices). The inflation rate measures how fast prices are rising. The unemployment rate measures the fraction of the labor force that is out of work. Macroeconomists study how these variables are determined, why they change over time, and how they interact with one another.
Figure 1-1 shows real GDP per person in the United States. Two aspects of this figure are noteworthy. First, real GDP grows over time. Real GDP per person today is about eight times higher than it was in 1900. This growth in average income allows us to enjoy a much higher standard of living than our great-
FIGURE 1-1

Data from: U.S. Department of Commerce, Economic History Association.
4
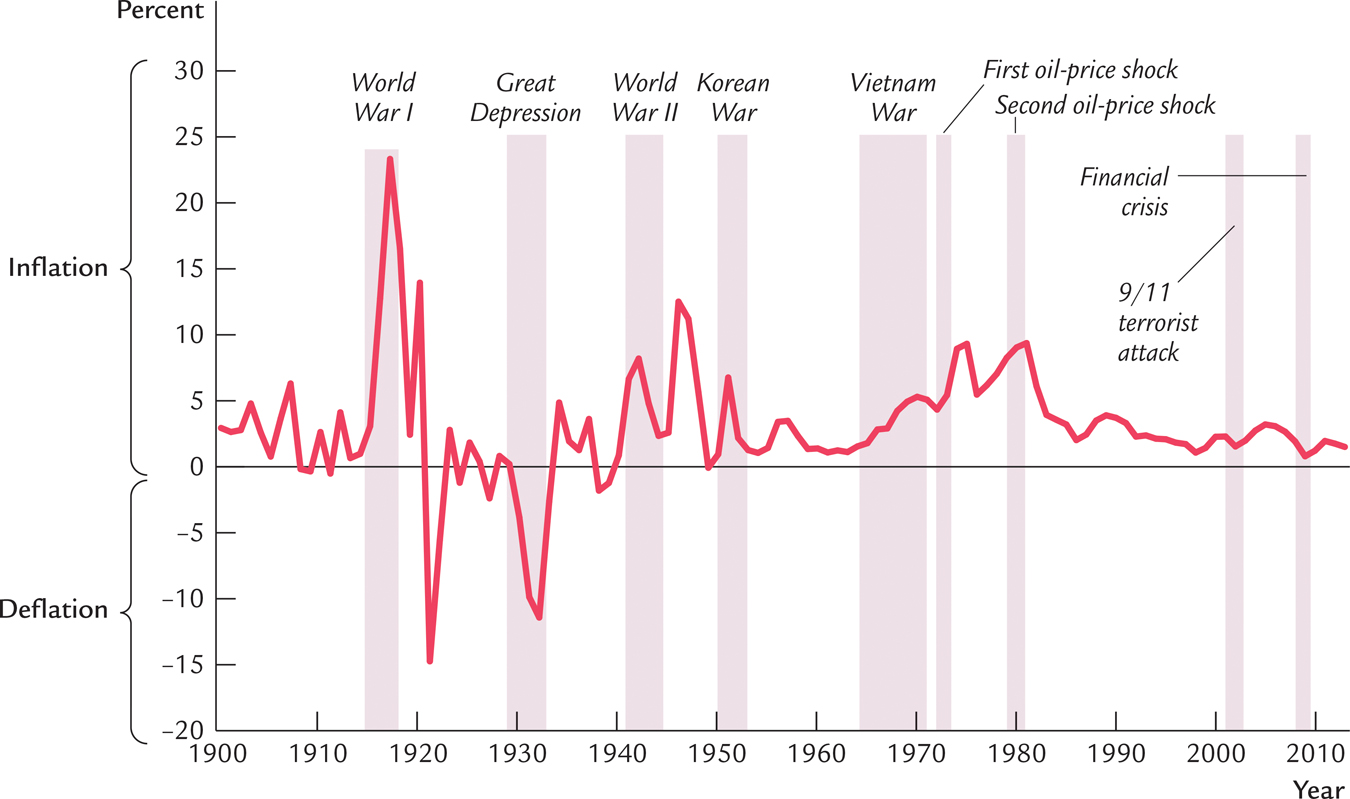
Figure 1-2 shows the U.S. inflation rate. You can see that inflation varies substantially over time. In the first half of the twentieth century, the inflation rate averaged only slightly above zero. Periods of falling prices, called deflation, were almost as common as periods of rising prices. By contrast, inflation has been the norm during the past half century. Inflation became most severe during the late 1970s, when prices rose at a rate of almost 10 percent per year. In recent years, the inflation rate has been about 2 percent per year, indicating that prices have been fairly stable.
FIGURE 1-2

Data from: U.S. Department of Commerce, Economic History Association
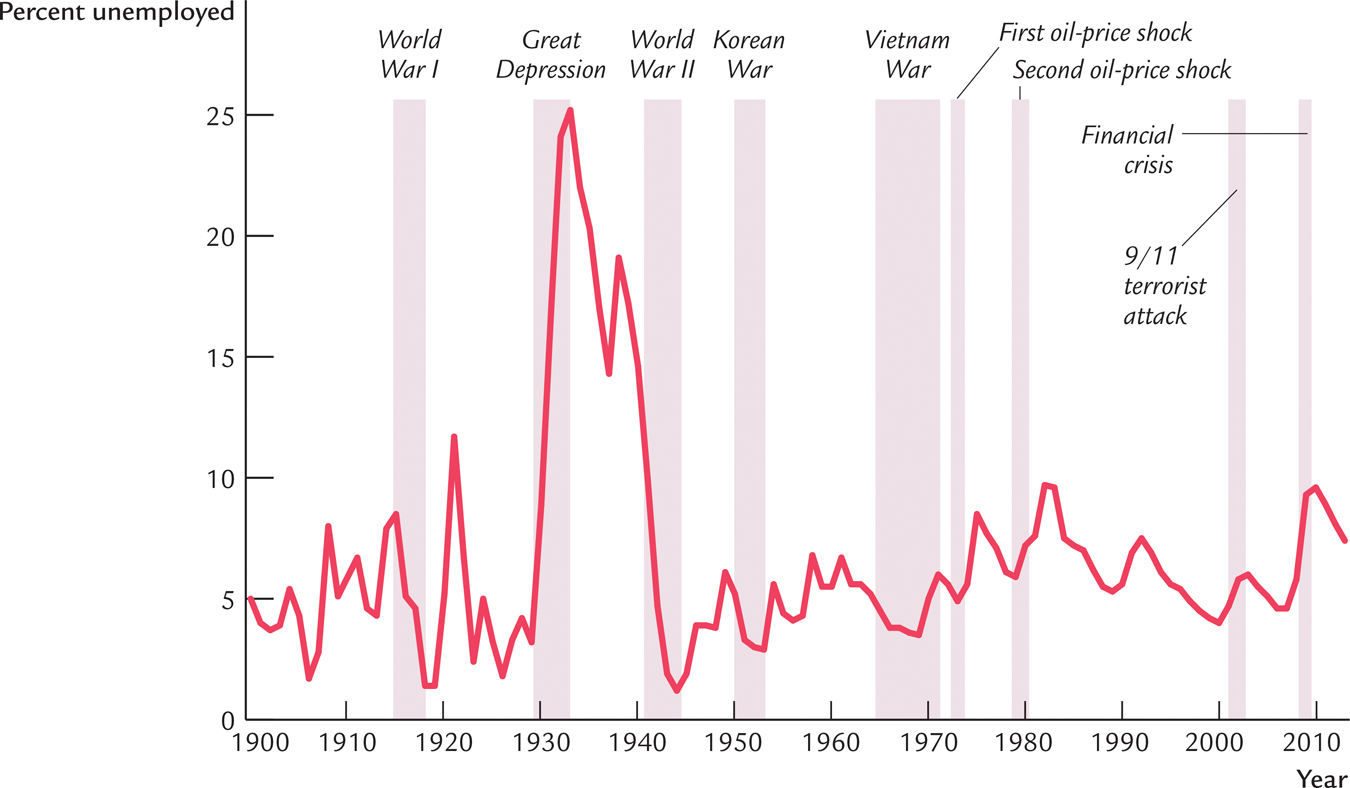
Figure 1-3 shows the U.S. unemployment rate. Notice that there is always some unemployment in the economy. In addition, although the unemployment rate has no long-
FIGURE 1-3

5
These three figures offer a glimpse at the history of the U.S. economy. In the chapters that follow, we first discuss how these variables are measured and then develop theories to explain how they behave. 