7-4 Labor-Market Experience: The United States
So far we have developed the theory behind the natural rate of unemployment. We began by showing that the economy’s steady-
With these theories as background, we now examine some additional facts about unemployment, focusing at first on the case of American labor markets. These facts will help us to evaluate our theories and assess public policies aimed at reducing unemployment.
The Duration of Unemployment
When a person becomes unemployed, is the spell of unemployment likely to be short or long? The answer to this question is important because it indicates the reasons for the unemployment and what policy response is appropriate. On the one hand, if most unemployment is short-
The answer to our question turns out to be subtle. The data show that many spells of unemployment are short but that most weeks of unemployment are attributable to the long-
To see how these facts can all be true, consider an extreme but simple example. Suppose that 10 people are unemployed for part of a given year. Of these 10 people, 8 are unemployed for 1 month and 2 are unemployed for 12 months, totaling 32 months of unemployment. In this example, most spells of unemployment are short: 8 of the 10 unemployment spells, or 80 percent, end in 1 month. Yet most months of unemployment are attributable to the long-
197
This evidence on the duration of unemployment has an important implication for public policy. If the goal is to substantially lower the natural rate of unemployment, policies must aim at the long-
CASE STUDY
The Increase in U.S. Long-
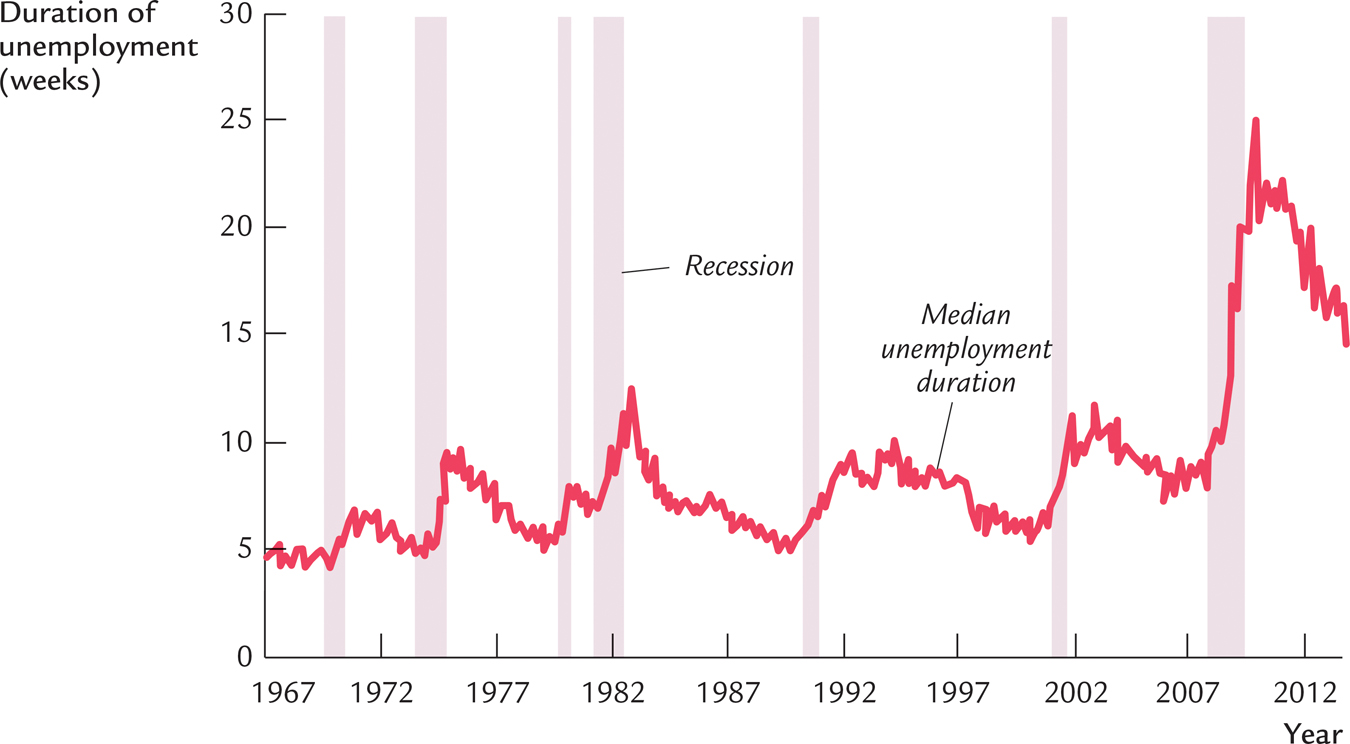
In 2008 and 2009, as the U.S. economy experienced a deep recession, the labor market demonstrated a new and striking phenomenon: a large upward spike in the duration of unemployment. Figure 7-4 shows the median duration of unemployment for jobless workers from 1967 to 2014. Recessions are indicated by shaded areas. The figure shows that the duration of unemployment typically rises during recessions. The huge increase during the recession of 2008–
FIGURE 7-4

What explains this phenomenon? Economists fall into two camps.
198
Some economists believe that the increase in long-
Harvard economist Robert Barro wrote an article in the August 30, 2010, issue of the Wall Street Journal titled “The Folly of Subsidizing Unemployment.” According to Barro, “the dramatic expansion of unemployment insurance eligibility to 99 weeks is almost surely the culprit” responsible for the rise in long-
Generous unemployment insurance programs have been found to raise unemployment in many Western European countries in which unemployment rates have been far higher than the current U.S. rate. In Europe, the influence has worked particularly through increases in long-
Barro concludes that the “reckless expansion of unemployment-
Other economists, however, are skeptical that these government policies are to blame. In their opinion, the extraordinary increase in eligibility for unemployment insurance was a reasonable and compassionate response to a historically deep economic downturn and weak labor market.
Here is Princeton economist Paul Krugman, writing in a July 4, 2010, New York Times article titled “Punishing the Jobless”:
Do unemployment benefits reduce the incentive to seek work? Yes: workers receiving unemployment benefits aren’t quite as desperate as workers without benefits, and are likely to be slightly more choosy about accepting new jobs. The operative word here is “slightly”: recent economic research suggests that the effect of unemployment benefits on worker behavior is much weaker than was previously believed. Still, it’s a real effect when the economy is doing well.
But it’s an effect that is completely irrelevant to our current situation. When the economy is booming, and lack of sufficient willing workers is limiting growth, generous unemployment benefits may keep employment lower than it would have been otherwise. But as you may have noticed, right now the economy isn’t booming—
Wait: there’s more. One main reason there aren’t enough jobs right now is weak consumer demand. Helping the unemployed, by putting money in the pockets of people who badly need it, helps support consumer spending.8
Barro and Krugman are both prominent economists, but they have diametrically opposed views about this fundamental policy debate. The cause of the spike in U.S. long-
199
Variation in the Unemployment Rate Across Demographic Groups
The rate of unemployment varies substantially across different groups within the population. Table 7-2 presents the U.S. unemployment rates for different demographic groups in 2013, when the overall unemployment rate was 6.2 percent.
TABLE 7-2
TABLE 7-

This table shows that younger workers have much higher unemployment rates than older ones. To explain this difference, recall our model of the natural rate of unemployment. The model isolates two possible causes for a high rate of unemployment: a low rate of job finding and a high rate of job separation. When economists study data on the transition of individuals between employment and unemployment, they find that those groups with high unemployment tend to have high rates of job separation. They find less variation across groups in the rate of job finding. For example, an employed white male is four times more likely to become unemployed if he is a teenager than if he is middle-
These findings help explain the higher unemployment rates for younger workers. Younger workers have only recently entered the labor market, and they are often uncertain about their career plans. It may be best for them to try different types of jobs before making a long-
Another fact that stands out from Table 7-2 is that unemployment rates are much higher for blacks than for whites. This phenomenon is not well understood. Data on transitions between employment and unemployment show that the higher unemployment rates for blacks, especially for black teenagers, arise because of both higher rates of job separation and lower rates of job finding. Possible reasons for the lower rates of job finding include less access to informal job-
Transitions Into and Out of the Labor Force
So far we have ignored an important aspect of labor-
200
In fact, movements into and out of the labor force are important. About one-
Individuals entering and leaving the labor force make unemployment statistics more difficult to interpret. On the one hand, some individuals calling themselves unemployed may not be seriously looking for jobs and perhaps should best be viewed as out of the labor force. Their “unemployment” may not represent a social problem. On the other hand, some individuals may want jobs but, after unsuccessful searches, have given up looking. These discouraged workers are counted as being out of the labor force and do not show up in unemployment statistics. Even though their joblessness is unmeasured, it may nonetheless be a social problem.
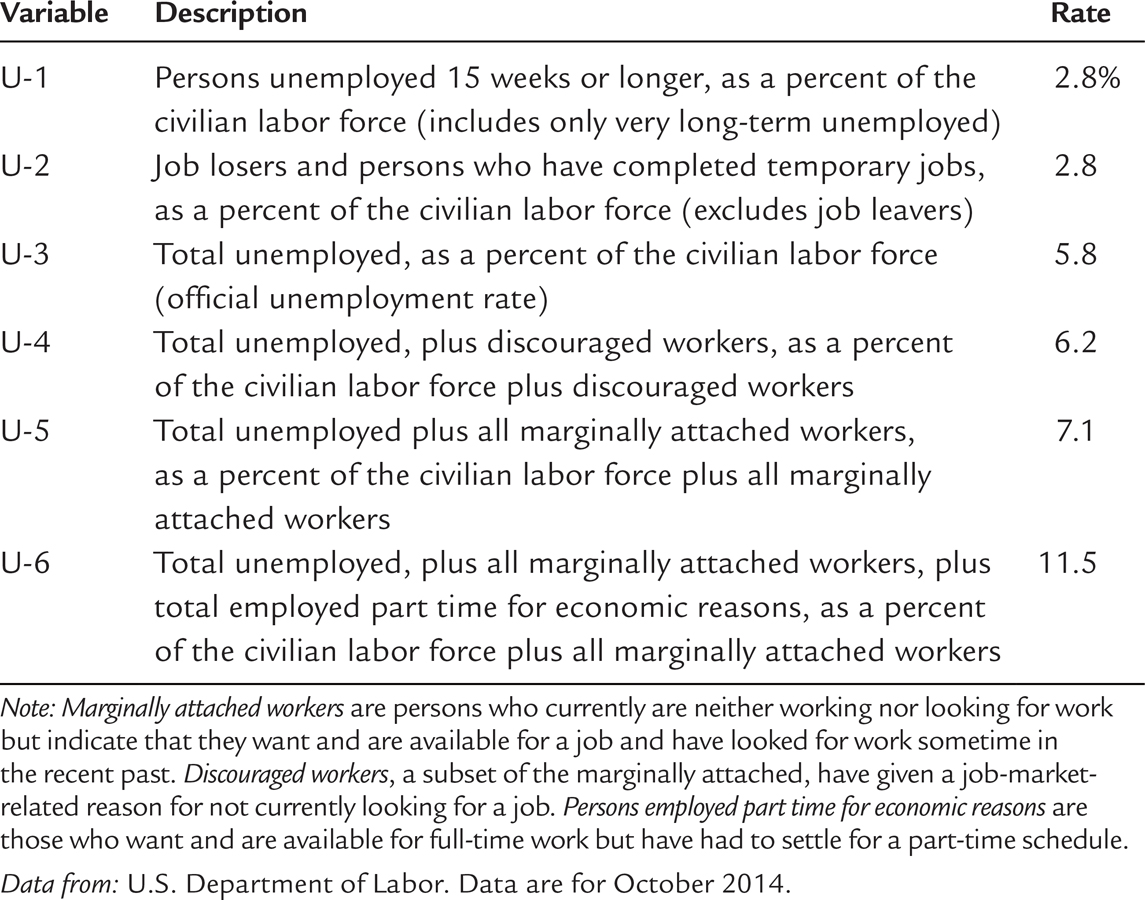
Because of these and many other issues that complicate the interpretation of the unemployment data, the Bureau of Labor Statistics calculates several measures of labor underutilization. Table 7-3 gives the definitions and their values as of October 2014. The measures range from 2.8 to 11.5 percent, depending on the characteristics one uses to classify a worker as not fully employed.
TABLE 7-3
TABLE 7-

201
CASE STUDY
The Decline in Labor-
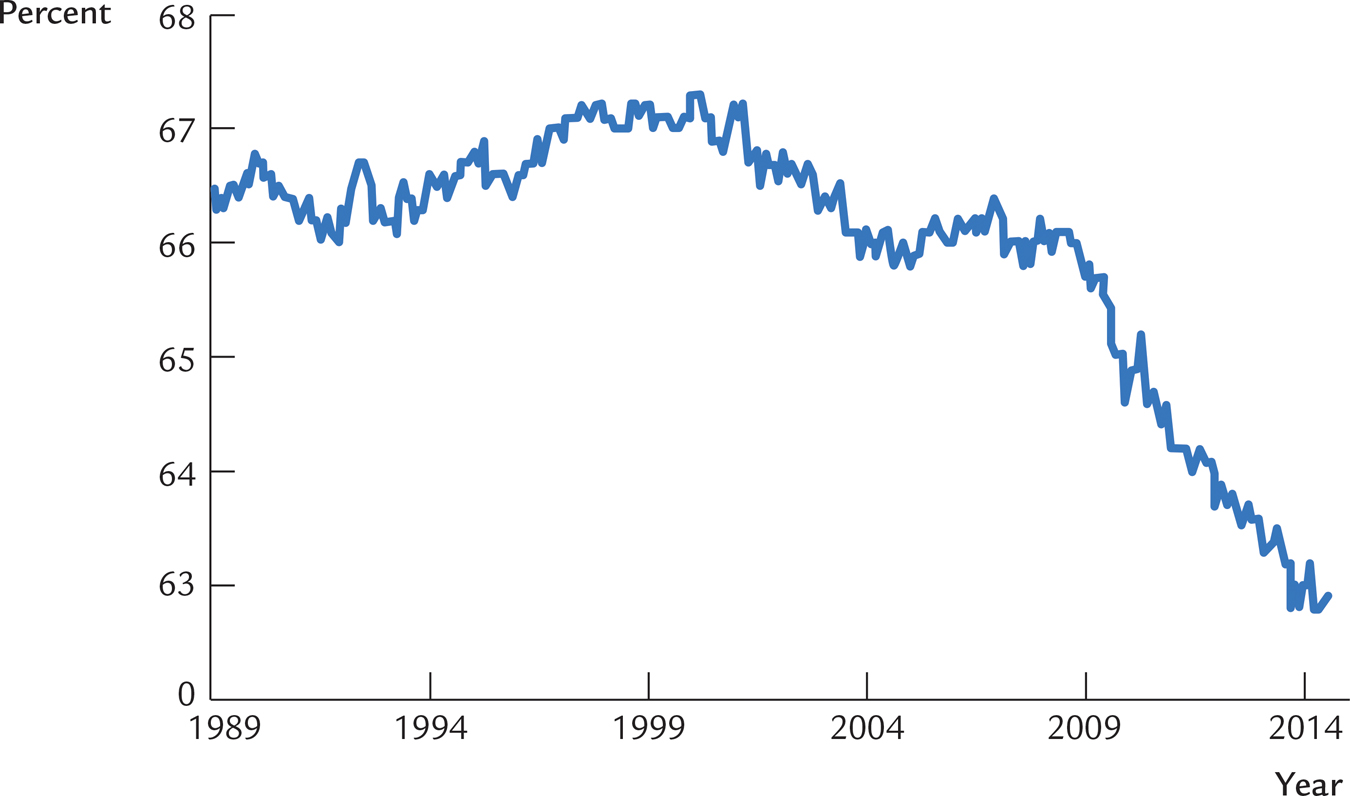
One of the more striking recent developments in the U.S. labor market is the decline in labor-
FIGURE 7-5

What explains the decline of 3.1 percentage points in the labor-
His findings, summarized in Table 7-4, allocate the 3.1 percentage points among five categories:
An increase in retired workers accounts for 1.4 percentage points.
An increase in disabled workers accounts for 0.8 percentage points.
An increase in discouraged workers accounts for 0.4 percentage points.
202
An increase in those not wanting a job because they are in school accounts for 0.5 percentage points.
The “other” category—
those outside the labor force who are not retired, disabled, discouraged, or in school, such as full- time parents— accounts for none of the change. In fact, this last category went slightly in the other direction.
TABLE 7-4
TABLE 7-

With this decomposition in hand, we can discuss some of the forces at work.
According to the numbers in Table 7-4, retirement explains the largest share of the increase in nonparticipation, accounting for almost half the change. The increase in the number of retired workers is largely due to the aging of the large baby-
Another force at work is that during much of the period from 2007 to 2014, the economy was weak. Because of a financial crisis and deep recession (a topic discussed in detail in Chapter 12 and Chapter 20), unemployment, especially long-
To be sure, these developments are not entirely adverse. For the elderly, retirement is often a welcome change in lifestyle after a lifetime of toil. For the young, staying in school is often a sensible investment in human capital. Yet the decline in labor-
203