FIGURE 10-7
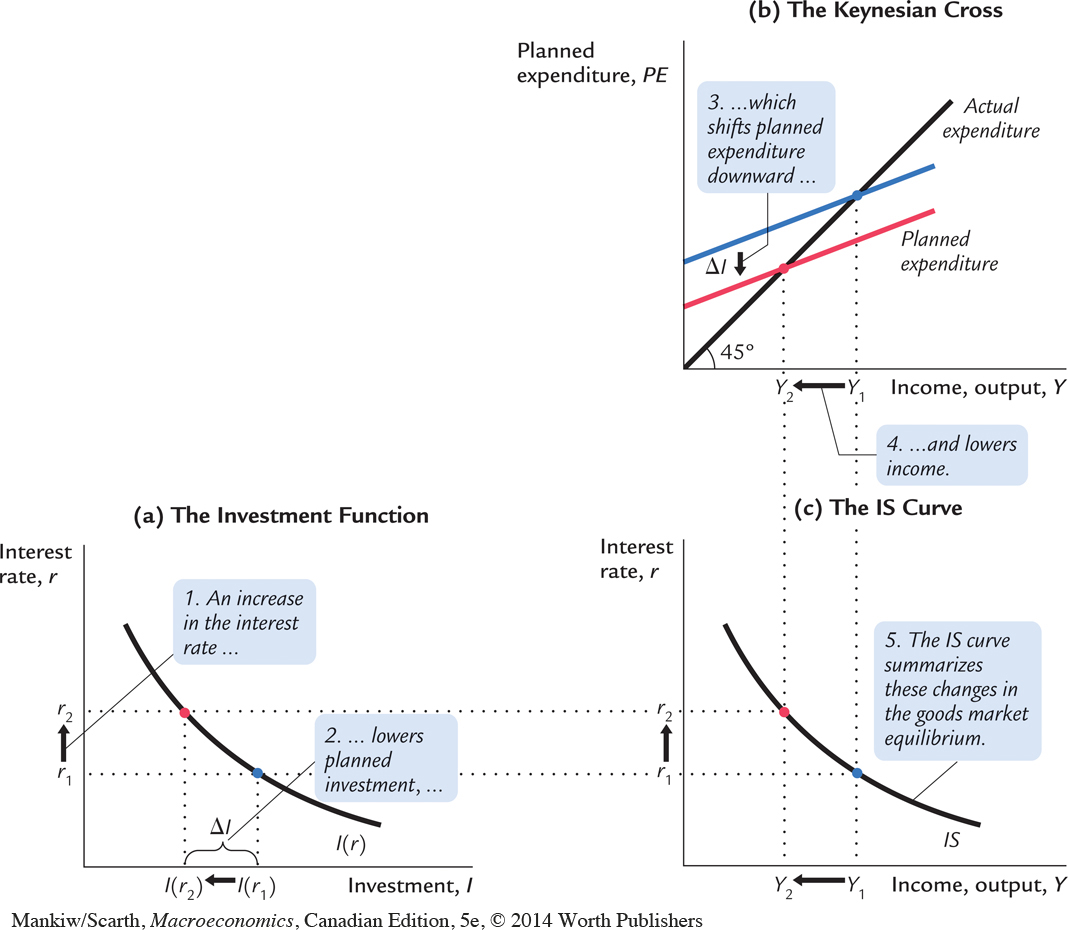 Deriving the IS Curve Panel (a) shows the investment function: an increase in the interest rate from r1 to r2 reduces planned investment from I(r1) to I(r2). Panel (b) shows the Keynesian cross: a decrease in planned investment from I(r1) to I(r2) shifts the planned-expenditure function downward and thereby reduces income from Y1 to Y2. Panel (c) shows the IS curve summarizing this relationship between the interest rate and income: the higher the interest rate, the lower the level of income.