FIGURE 10-9
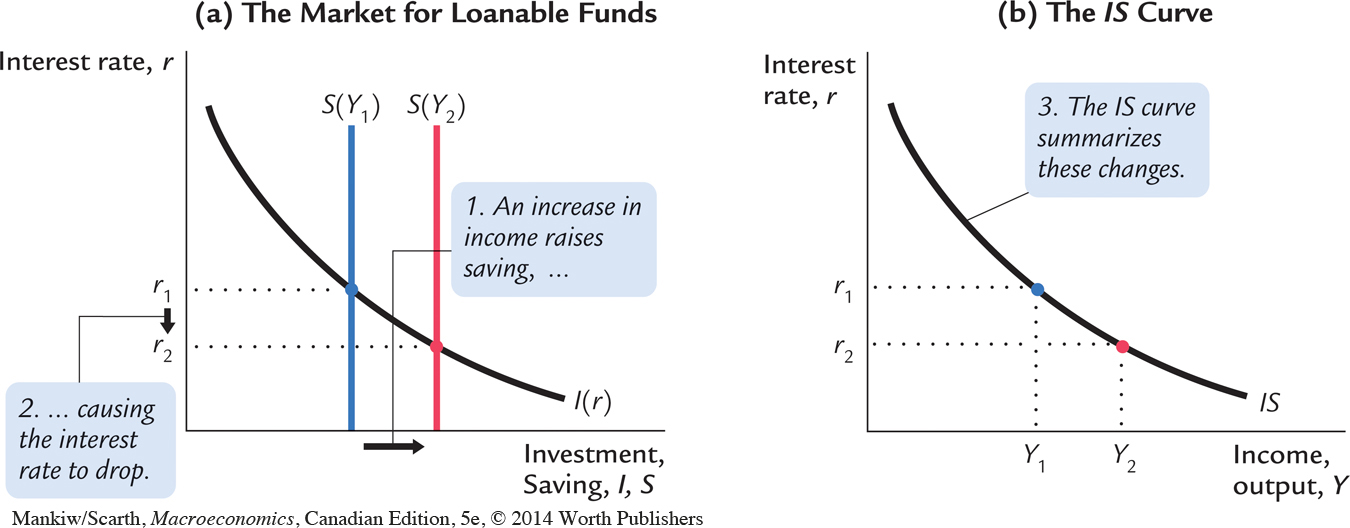 A Loanable-Funds Interpretation of the IS Curve Panel (a) shows that an increase in income from Y1 to Y2 raises saving and thus lowers the interest rate that equilibrates the supply and demand for loanable funds. The IS curve in panel (b) expresses this negative relationship between income and the interest rate.