FIGURE 12-4
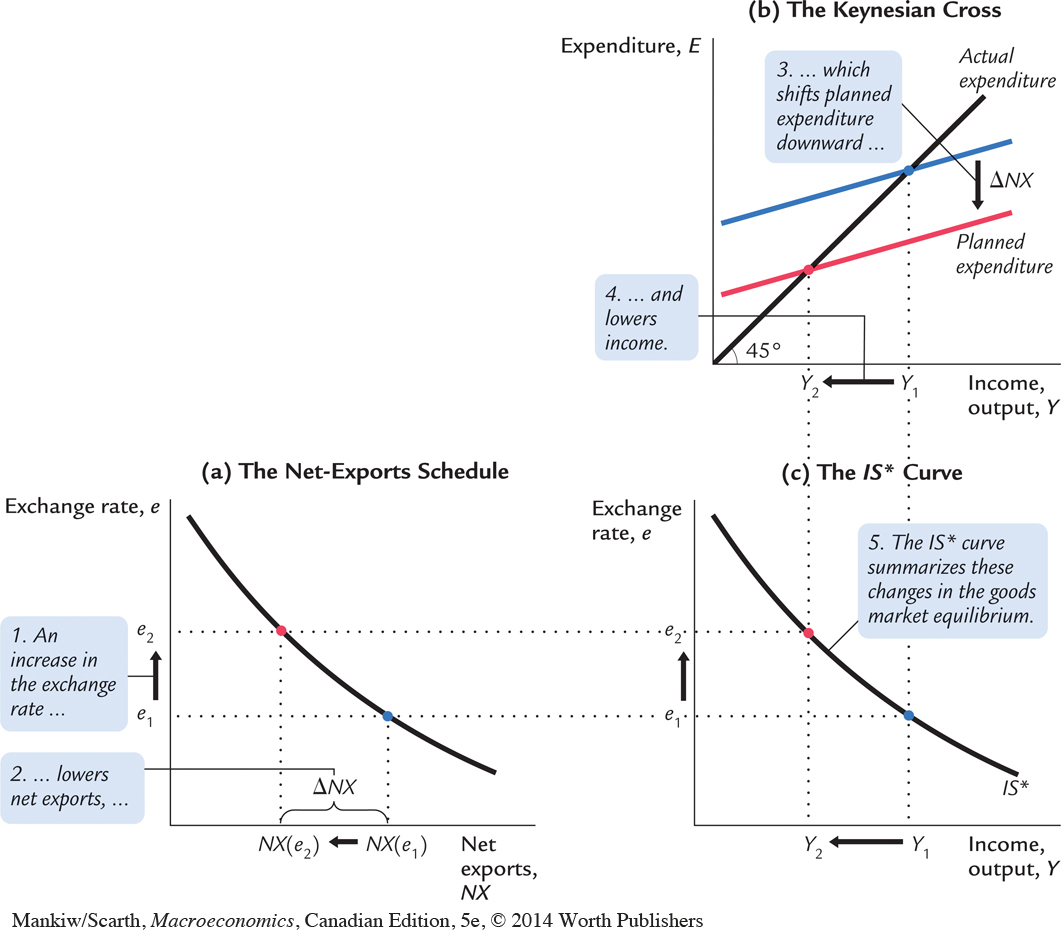 The IS* Curve The IS* curve is derived from the net-exports schedule and the Keynesian cross. Panel (a) shows the net-exports schedule: an increase in the exchange rate from e1 to e2 lowers net exports from NX(e1) to NX(e2). Panel (b) shows the Keynesian cross: a decrease in net exports from NX(e1) to NX(e2) shifts the planned-expenditure schedule downward and reduces income from Y1 to Y2. Panel (c) shows the IS* curve summarizing this relationship between the exchange rate and income: the higher the exchange rate, the lower the level of income.