FIGURE 12-16
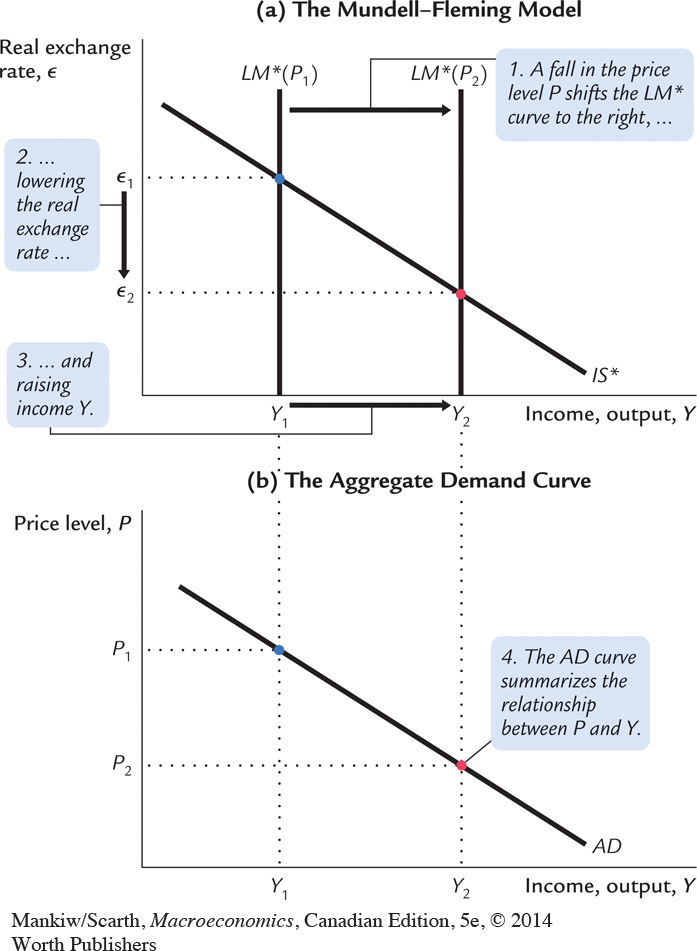 Mundell–Fleming as a Theory of Aggregate Demand Panel (a) shows that when the price level falls, the LM* curve shifts to the right. The equilibrium level of income rises. Panel (b) shows that this negative relationship between P and Y is summarized by the aggregate demand curve.