FIGURE 14-9
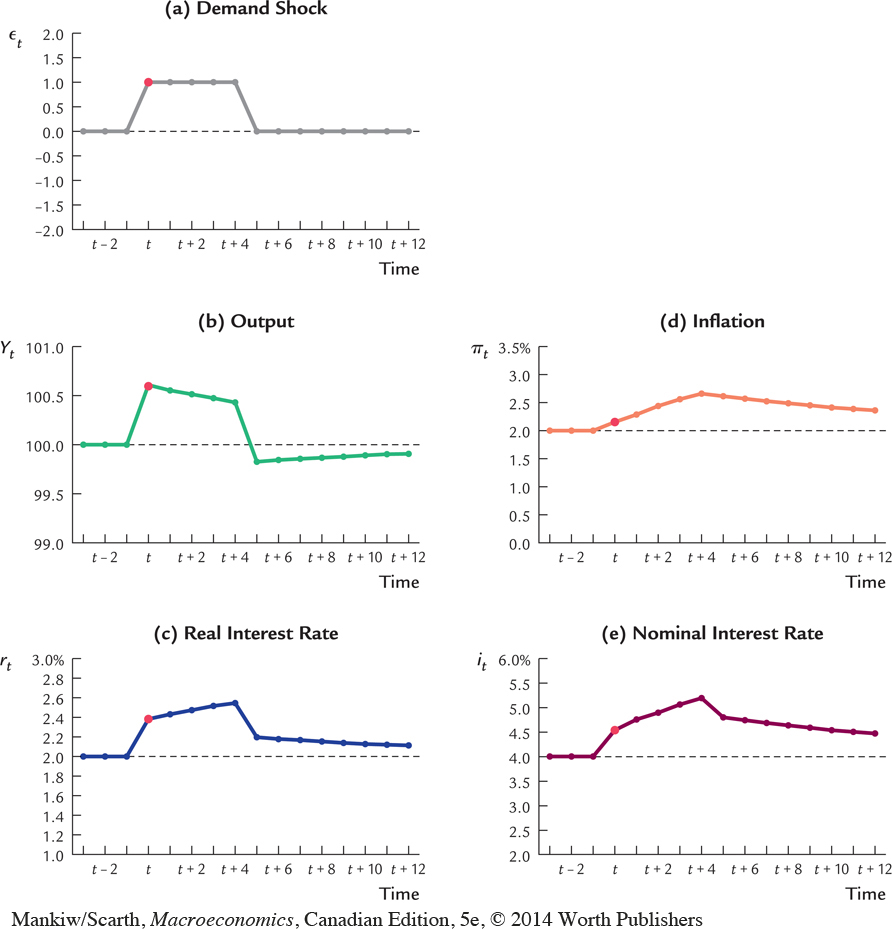 The Dynamic Response to a Demand Shock This figure shows the responses of the key variables over time to a positive 1-percent demand shock that lasts for five periods.The Dynamic Response to a Demand Shock This figure shows the responses of the key variables over time to a positive 1-percent demand shock that lasts for five periods.