FIGURE 14-10
 A Reduction in Target Inflation A permanent reduction in target inflation in period t shifts the dynamic aggregate demand curve to the left from DADt–1 to DADt, +t1, . . . . Initially, the economy moves from point A to point B. Both inflation and output fall. In the subsequent period, because expected inflation falls, the dynamic aggregate supply curve shifts downward. The economy moves from point B to point C in period t + 1. Over time, as expected inflation falls and the dynamic aggregate supply curve repeatedly shifts downward, the economy approaches a new equilibrium at point Z. Output returns to its natural level
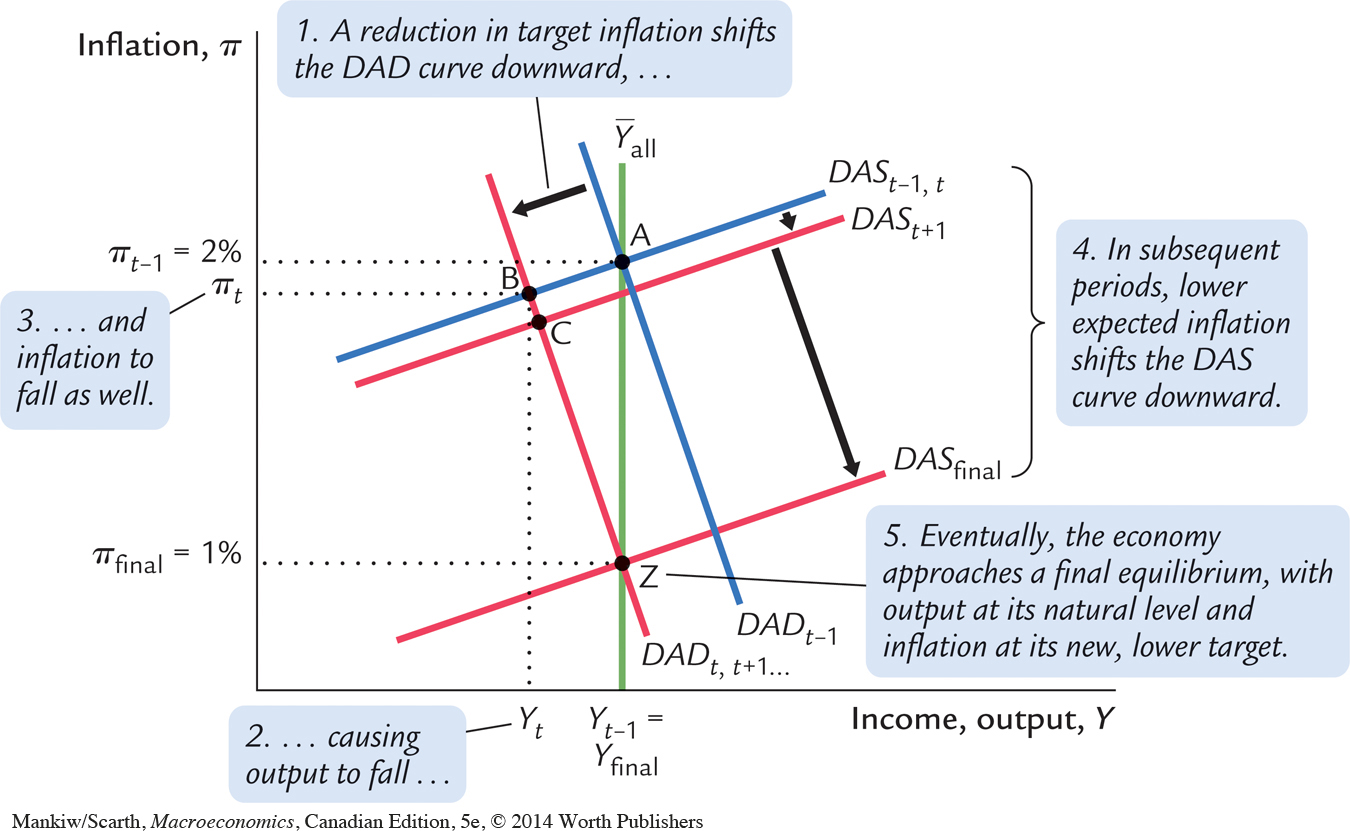
  , and inflation ends at its new, lower target (πt*, t+1, . . . = 1 percent).