Chapter 7. Chapter 7 Interpreting Graphs and Recognizing Relationships
Pre-Test Question:
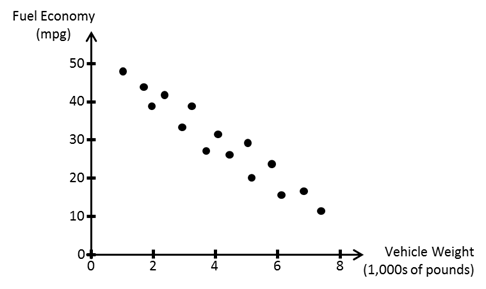
The graph above shows the fuel economy and vehicle weight for a number of different types of automobiles. Based on the graph, what is the relationship between fuel economy and vehicle weight?
| A. |
| B. |
| C. |
| D. |
Video
Post-Test Questions:
1.
The graph below shows the time it takes to fully cook a turkey based on weight. Based on the graph, what is the relationship between turkey weight and time to fully cook?

| A. |
| B. |
| C. |
| D. |
2.
The graph below shows the relationship between the number of years worked and the amount of retirement savings. After 10 years of working, how much retirement savings will you have?

| A. |
| B. |
| C. |
| D. |
3.
The graph below shows the height and intelligence for a number of people. Based on the graph, what is the relationship between height and intelligence?

| A. |
| B. |
| C. |
| D. |
4.
The graph below shows the fuel economy and vehicle weight for a number of different types of automobiles. Which variable is on the x-axis?

| A. |
| B. |
5.
The graph below shows the age and the number of days worker per year for a number of people. Based on the graph, what is the relationship between age and the number of days worked per year?
| A. |
| B. |
| C. |
| D. |