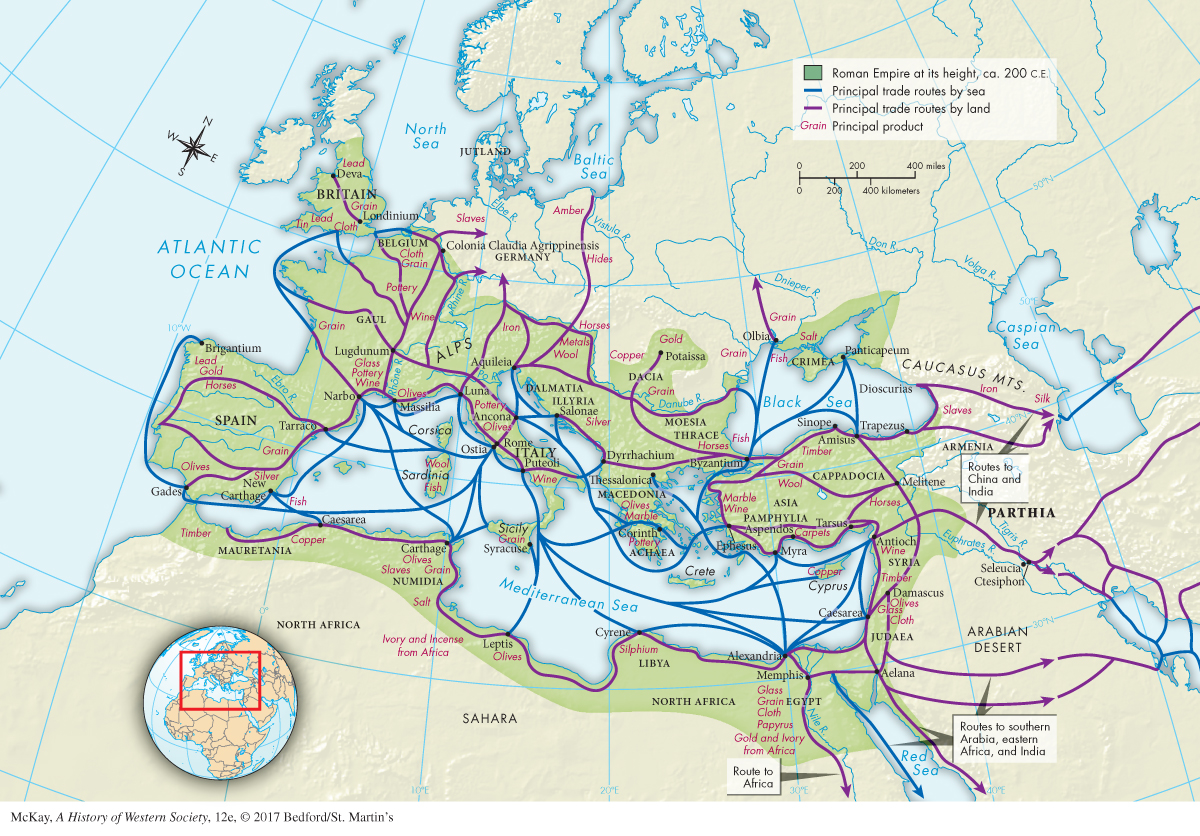
MAPPING THE PASTMAP 6.2 Production and Trade in the Pax Romana, ca. 27 B.C.E.–180 C.E. This map gives a good idea of the principal products of various parts of the Roman Empire at its height and the trade routes connecting these regions. Map 10.2 is a similar map that shows products and trade in roughly the same area nearly a millennium later. Examine both maps and answer the following questions.ANALYZING THE MAP What similarities and differences do you see in products during these two periods?CONNECTIONS To what extent did Roman trade routes influence later European trade routes?