A History of Western Society: Printed Page 586
Printed Page 586-0-0(cont.)
Mapping the Past for Chapter 18
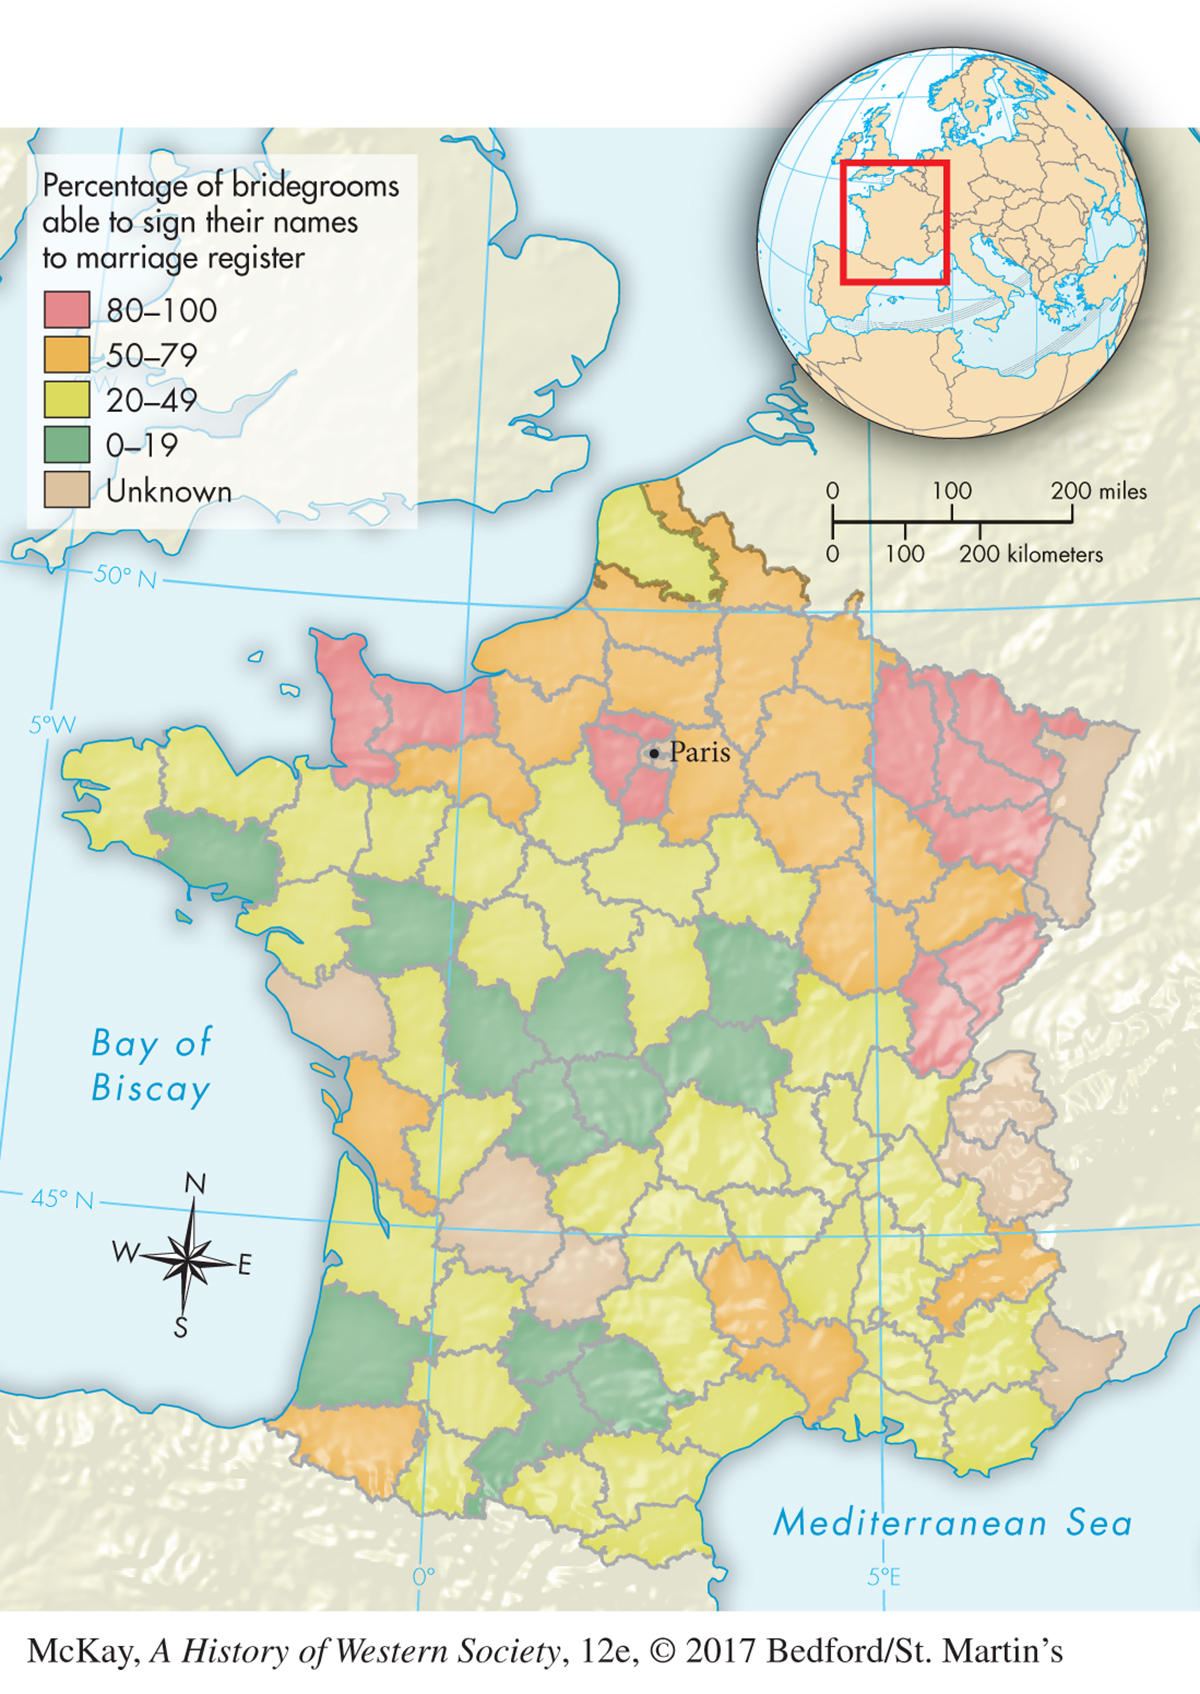
MAPPING THE PASTMAP 18.1 Literacy in France, ca. 1789 Literacy rates increased but still varied widely between and within states in eighteenth-century Europe. ANALYZING THE MAP What trends in French literacy rates does this map reveal? Which regions seem to be ahead? How would you explain the regional variations?CONNECTIONS Note the highly variable nature of literacy rates across the country. Why might the rate of literacy be higher closer to the capital city of Paris? Why would some areas have low rates?