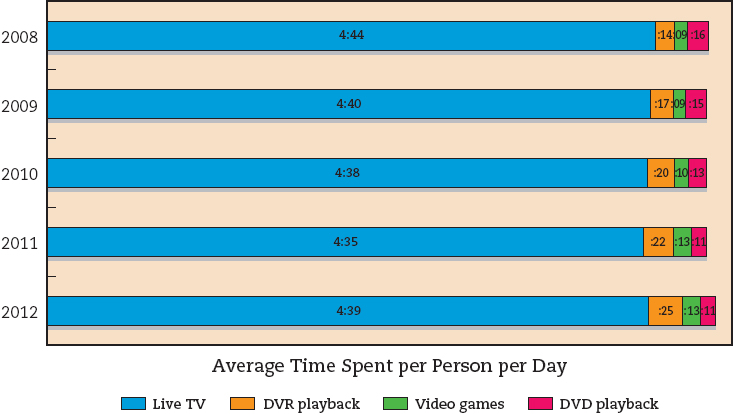
FIGURE 6.3 CROSS-PLATFORM VIEWING IN HOURS AND MINUTES
Source: Nielsen, The Cross Platform Report, March 2013, http://www.slideshare.net/mapleaikon/crossplatform-report-march-2013-nielsen.
Source: Nielsen, The Cross Platform Report, March 2013, http://www.slideshare.net/mapleaikon/crossplatform-report-march-2013-nielsen.