14.9–14.11 Solutions
The central question of this chapter asks how we might mitigate and adapt to the environmental and social impacts of climate change. The consensus among climate scientists is that the best way to stem climate change is by reducing fossil fuel use and increasing protection of forests and other ecosystems that serve as carbon sinks. The Intergovernmental Panel on Climate Change (IPCC) was established in 1988 to bring together experts on climate change from around the world to review the evidence and make policy recommendations. Two years later, the IPCC released its first report, calling for an international treaty to address the prospect of climate change. In 1997, the heads of state of 192 nations began to sign on to the Kyoto Protocol, which required developed countries to reduce their greenhouse gas emissions below 1990 levels. The reason the Protocol focused on developed countries is that those countries have the highest levels of greenhouse gas emissions per capita. The United States, which has less than 5% of the world’s population, accounts for one-
Despite an initial wave of support for the Kyoto Protocol, it never entered into force. The United States initially signed it, but the U.S. Senate did not ratify it due to the treaty’s focus on greenhouse gas reductions in developed countries and its potential to handicap the U.S. economy. Indeed, China and India, which represent one-
14.9 Developing a road map to reduce carbon emissions
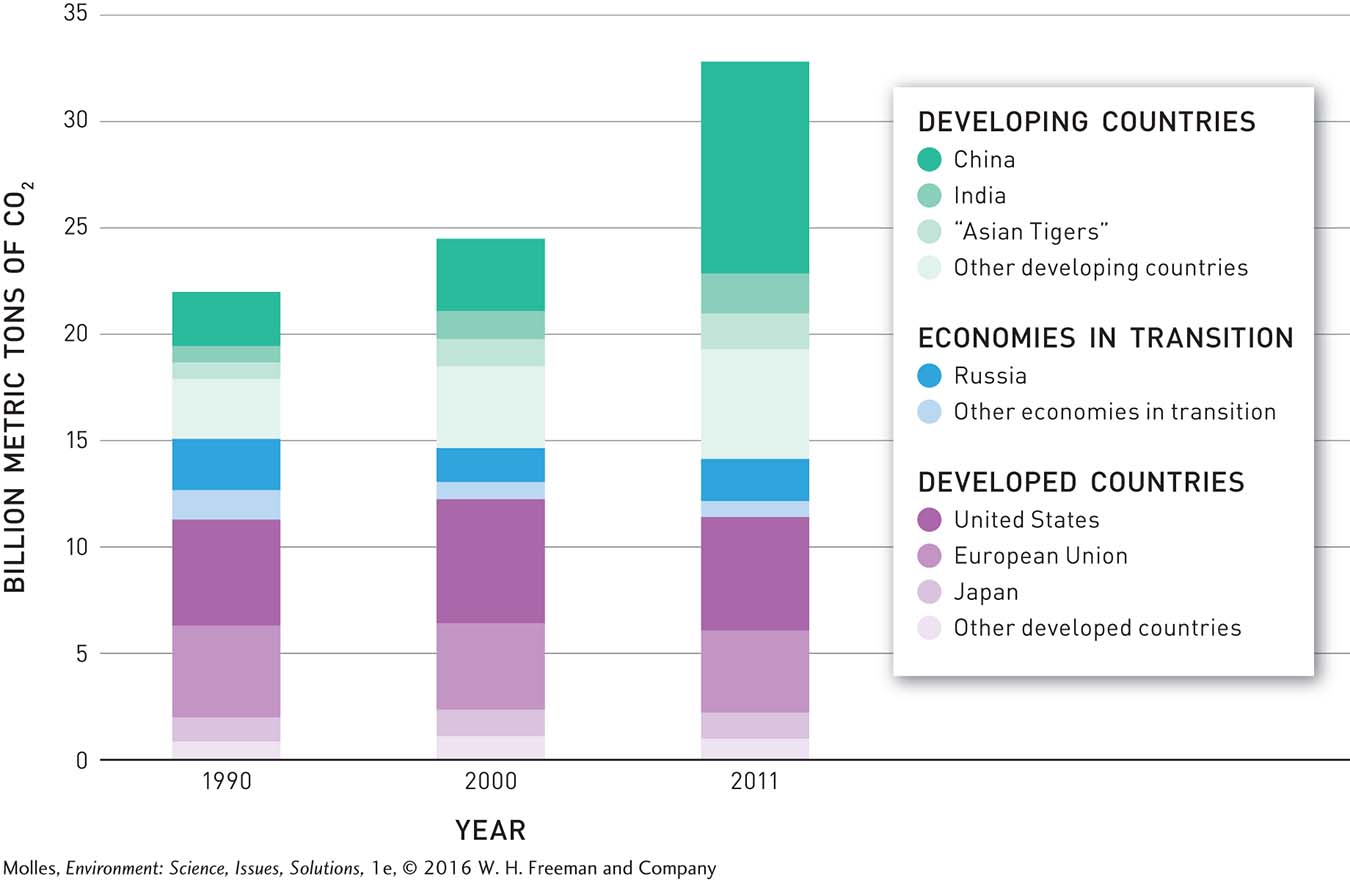
In the two decades since the Kyoto Protocol mapped a path to reducing greenhouse gas emissions, emissions have, in fact, increased by approximately 50%. As anticipated, most of this increase has been the result of economic development in developing countries, such as China and India, where emissions jumped nearly 180% (Figure 14.32). These countries are following in the footsteps of the United States, where about 40% of our greenhouse gas emissions come from electricity generation that powers corporate, industrial, and residential buildings, and another 30% from the transportation sector.

Is it fair to expect developing countries to agree to the same carbon dioxide emissions guidelines, since they did not have the benefit of several decades of unregulated fossil fuel use?
However, developing countries do not necessarily have to look to the United States as a model. Germany, for instance, is a highly developed country with a strong economy that produces about half the greenhouse gas emissions per capita as the United States. How did the Germans do it? They have achieved this, in part, by conserving fossil fuels and replacing oil, natural gas, and coal with renewable energy resources such as wind and solar power. Such a transition requires not only political incentives and advances in engineering, but also a careful accounting of the environmental and economic costs and benefits of various energy sources in different applications.
Evaluating Carbon Footprints of Electrical Generation
The first way we can reduce our emissions is by switching our energy sources to sources with lower CO2 emissions. In order to do this, we need accurate measurements of each source of energy: How much CO2 does each release from start to finish?
Consider the fact that it takes about 1 pound of coal to keep a 100-
life cycle assessment (LCA) An estimate of the total environmental impact of a product or technology as a result of activities such as extraction of an energy source (e.g., coal), transport, processing of raw materials, construction, maintenance, dismantling, removal, and recycling or disposal of structures.
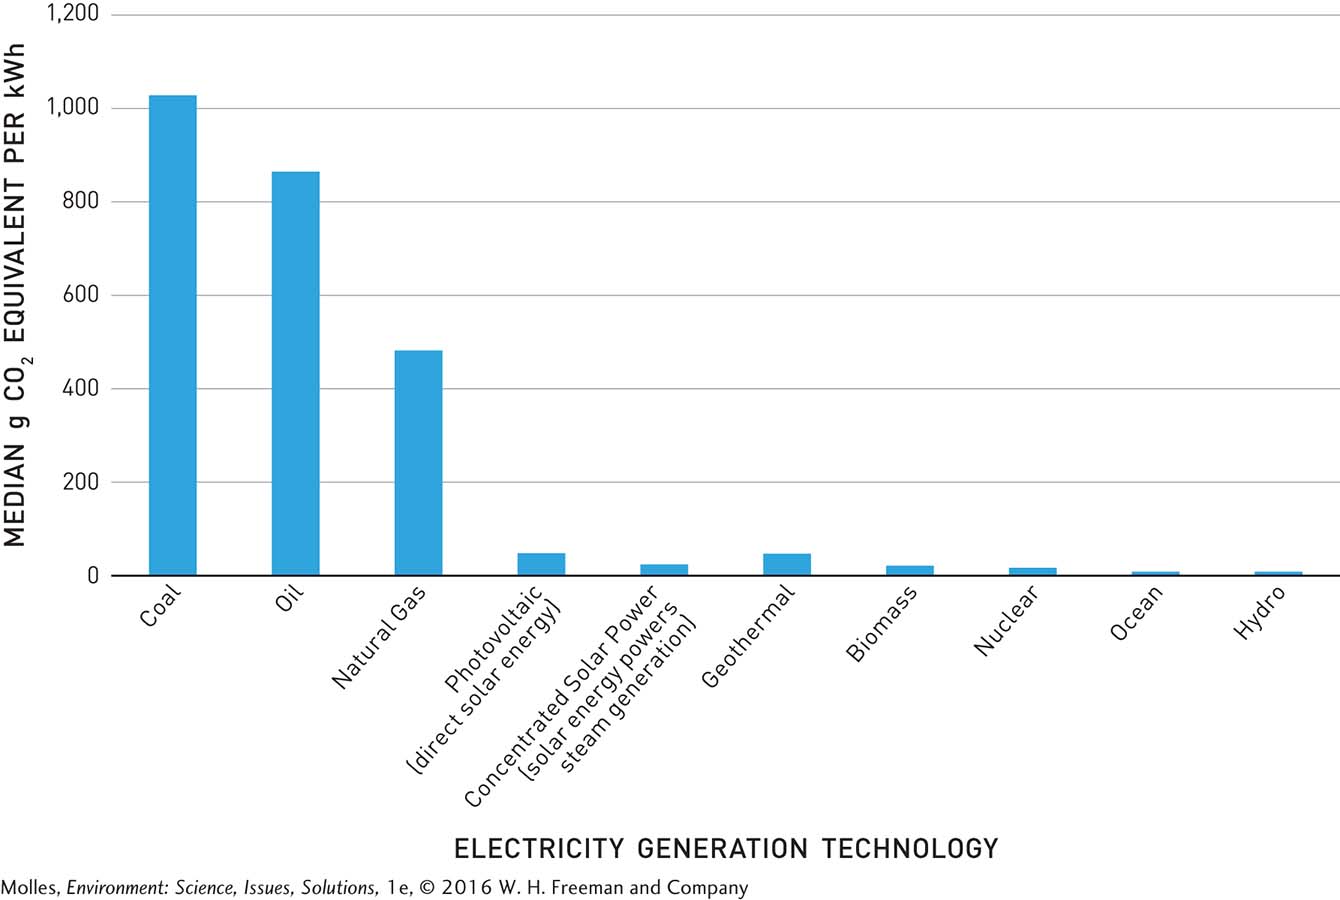
Nevertheless, these simple calculations only tell us how much carbon dioxide is produced during combustion at a power plant. To properly compare greenhouse gas emissions of different energy sources, including both fossil fuels and renewable energy supplies, we need to include other factors in our calculations, such as mining the materials used for solar cells, laying natural gas lines, or dismantling a nuclear power plant at the end of its life. Incorporating all these factors into calculations is called a life cycle assessment (LCA). The amount of greenhouse gases emitted in the process of generating electricity varies widely among energy sources, including fossil fuels (Figure 14.33).
carbon footprint The total amount of CO2 and other greenhouse gases produced over the course of the life cycle of a particular technology, individual, or population—
The result of a life cycle assessment of a technology used for electricity generation is the carbon footprint, which is expressed as grams of CO2 equivalent per kilowatt hour. We need to think in terms of CO2 equivalents, since other powerful greenhouse gases (like methane or nitrous oxide) can be emitted as by-
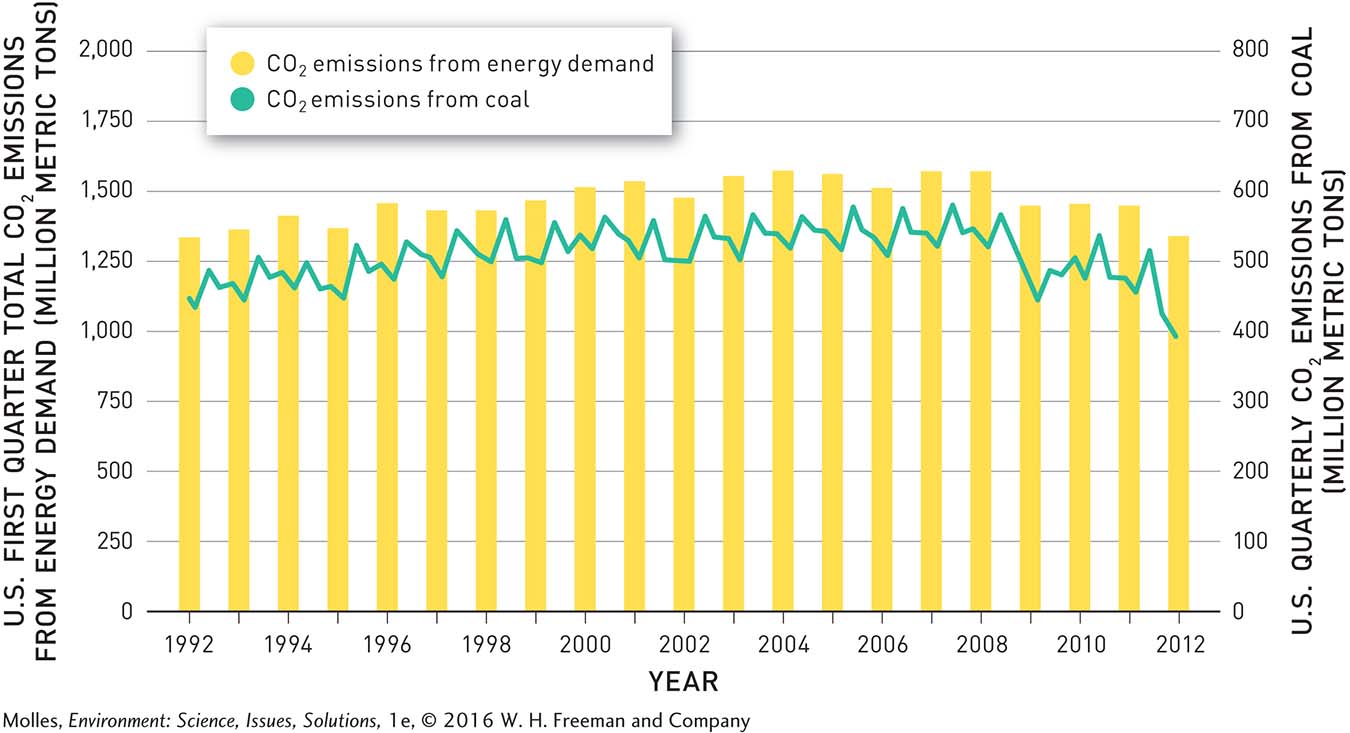
Using LCA for natural gas and coal, we see that natural gas is still much better than coal in terms of emissions of CO2 equivalents. There is, however, considerable controversy over the benefits of natural gas. Some new estimates claim that gas leaks are sufficient to make the carbon footprint of natural gas as large as or larger than that of coal. Regardless, as supplies of natural gas have increased and prices have decreased, many generating stations in the United States have switched from using coal to natural gas. Consequently, current estimates of greenhouse gas emissions by the United States fell significantly in 2012. In the first quarter of that year, energy-
Referring back to Figure 14.33, you will also notice that nuclear power has a small carbon footprint. France, for example, which generates 75% of its electricity from nuclear energy, along with about 15% from hydropower, has a very small carbon footprint. However, nuclear power is accompanied by other issues, from potential security risks to environmental contamination to nuclear accidents to issues around the safe disposal of nuclear waste (see Chapter 9).
Building dams for hydroelectric power may seem like a straightforward clean energy solution, but even they produce greenhouse gases. In Brazil, which has experienced a boom in dam-
Solar power, geothermal power, wind energy, and tidal energy are all renewable sources of energy with small carbon footprints, but they have suffered from limited availability and high costs. That seems to be changing, though. In the last three decades, the cost of solar power in the United States has plummeted from $75 per watt to $0.75 per watt, thanks to advances in technology, government subsidies, and competition from international manufacturers in China. Nevertheless, the cost of electricity from renewable energy is still greater than that produced by coal or natural gas. This means that a transition to renewable energy will likely require assistance from policy makers, which we will discuss later.
Increasing Transportation Efficiency
Developing more efficient transportation systems offers the second major opportunity for reducing greenhouse gas emissions. In the United States, the National Highway Traffic Safety Administration (NHTSA) sets targets for fuel efficiency through the Corporate Average Fuel Economy (CAFE) standards. Those standards are set in miles per gallon of fuel. In response to efforts by the NHTSA, engineering innovation, and increasing fuel prices, the fuel efficiency of the U.S. vehicle fleet has improved considerably over the years (Figure 14.35a). And as the amount of gasoline or diesel required for traveling a particular distance decreases, the amount of CO2 emitted into the environment also declines (Figure 14.35b).
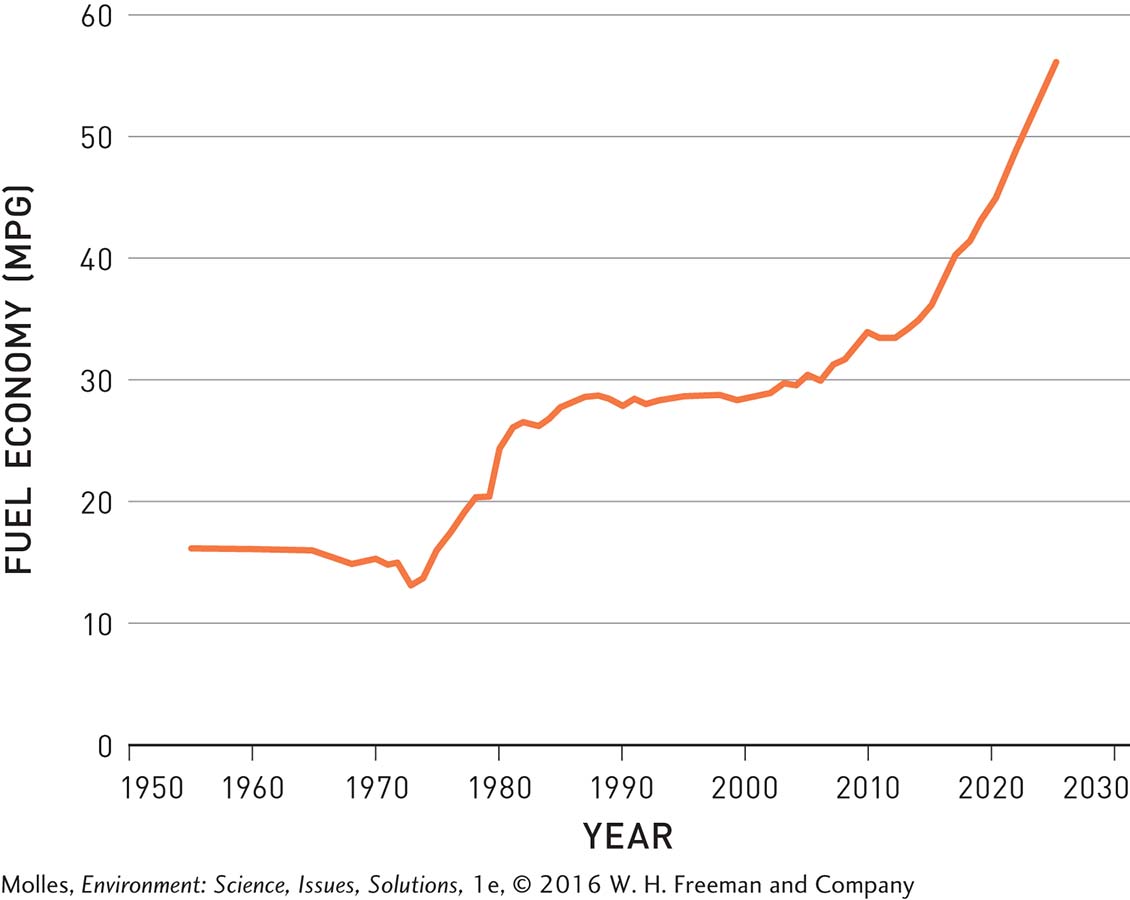
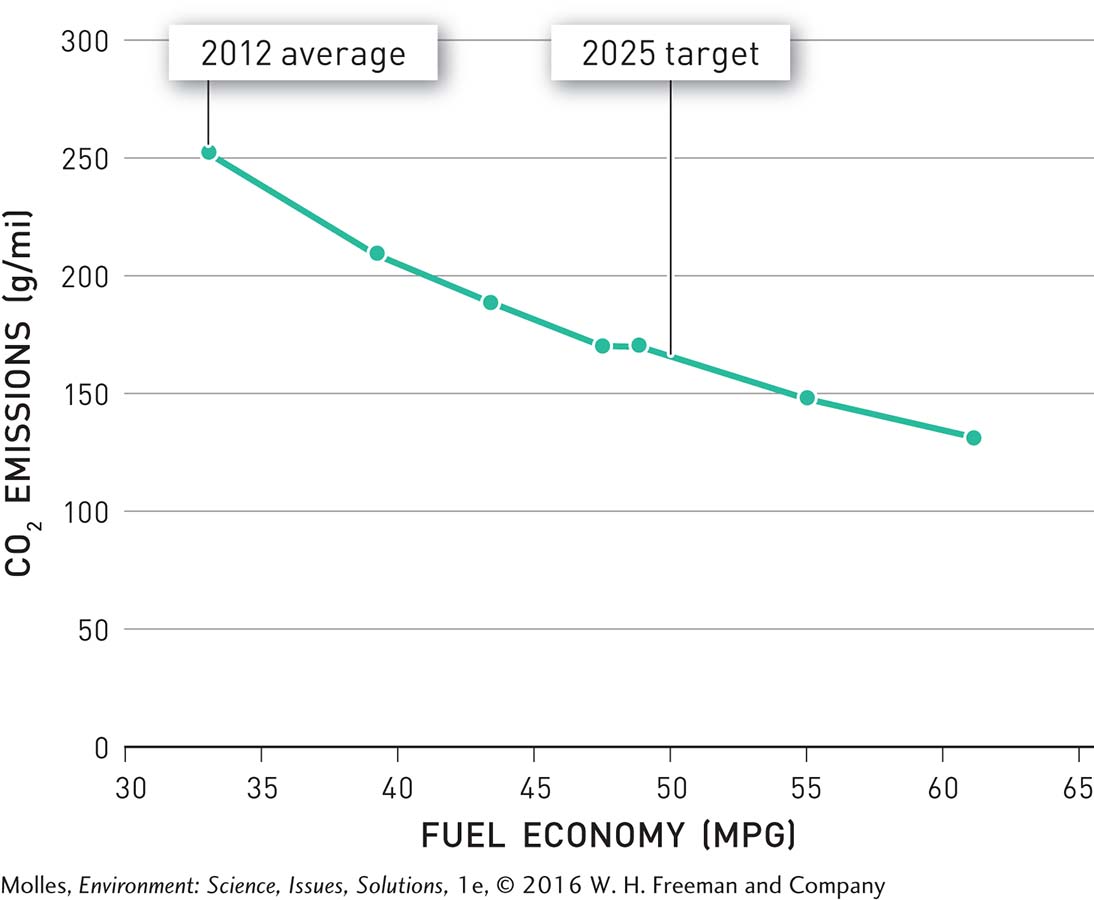
By NHTSA estimates, if the 2025 fuel efficiency targets are met, the amount of CO2 emitted by passenger cars and light trucks new in 2025 will be 40% lower than those meeting 2012 fuel standards. Consumers will realize savings from this greater fuel economy more than 3 times the added vehicle costs for the technology necessary to achieve the fuel economy. As a result of improved fuel efficiency standards, 4 billion fewer barrels of oil will be consumed over the lifetimes of vehicles manufactured between 2017 and 2025, which will in turn result in a reduction of CO2 emissions by approximately 1.8 billion metric tons.
Urban Design Can Reduce Fossil Fuel Use
Beyond improving fuel efficiency, urban planning is another way to decrease the impact of transportation systems in both the developed and developing world. Reducing urban sprawl, living in more compact cities, and telecommuting can decrease our reliance on fossil fuels for transportation. It would also reduce the need for new roads, which require cement production, a significant contributor to carbon dioxide emissions.
In addition, public transportation, such as buses and trains, along with bicycles, produce lower per capita greenhouse gas emissions than private cars. However, people will only take the bus or bike to work if they know it is efficient, clean, and safe. In terms of long-
Legislating Carbon Emissions
According to the IPCC, the cost for stabilizing the climate represents less than 2% of the global economy, whereas the cost of doing nothing could be as high as 20%. Given those numbers, reducing greenhouse gas emissions may seem like a no-
carbon taxes Tax on carbon emissions.
Like alcohol and cigarettes, carbon emissions impose a cost on society, and a tax is one way to recover those costs. Several countries, including Finland and Sweden, have already enacted modest carbon taxes, and the city of Boulder, Colorado, famously passed the first tax on carbon emissions from electricity in 2007, charging approximately $7 per ton of carbon. The $1 million the city earns every year is used to fund Boulder’s climate action plan, which helps encourage solar and wind power. In 2012 the Congressional Research Service pointed out that a tax rate of $20 per metric ton of carbon dioxide could cut the nation’s $1 trillion annual deficit in half. However, many businesses and economists strongly oppose a carbon tax, believing it would harm the country’s economic competitiveness and send business offshore. A second major criticism of the carbon tax is that it would have the greatest impact on low-
cap and trade Systems for regulating the emission of carbon dioxide and other pollutants.
carbon credit A permit to produce a certain amount of carbon emissions, which can be traded or sold, if the full emissions allowance is not used.
An alternative to a tax, and one of the most popular systems for regulating the emission of carbon dioxide and other pollutants, is known as a cap-
Although cap-
energy subsidies Government policies aimed at lowering the costs of energy production or lowering the cost to energy consumers.
Rather than penalizing emitters, energy subsidies, which are government policies aimed at lowering the costs of energy production or the cost to energy consumers, can also be used to spur the development and adoption of cleaner technologies that we will describe in the next section. Currently, subsidies are heavily weighted in support of fossil fuel development. For example, in 2013, the International Energy Agency estimated that government subsidies to fossil fuel industries around the world amounted to $550 billion annually, compared with $120 billion to renewable energy development. The agency concluded that the disparity is slowing renewable energy development. The National Resources Defense Council (NRDC), an environmental group, has estimated that simply cutting fossil fuel subsidies could reduce global carbon emissions by 6% by 2020.
Think About It
Does economic development require increasing greenhouse gas emissions?
Apart from greenhouse gas emissions, what other factors do we need to keep in mind when selecting energy sources?
Why has there been so much opposition to cap and trade in the United States?