4.2 Geographic patterns and processes influence biodiversity

What relationship do you expect between ecosystem diversity and species diversity in a landscape?
Now that we have reviewed species and ecosystem diversity, which reflect biodiversity within communities and across landscapes, let’s consider patterns of biodiversity at larger regional and global scales. In order to make conservation decisions, we need to know something about the biological differences among Earth’s various regions, such as islands and continents, and climatic zones, such as those on cold mountaintops or in the tropics. Such knowledge will help us choose the best places for biological reserves and will inform management of these areas.
The Terrestrial Biomes

How might the map in Figure 4.3 change with global warming?
biome Associations of plants, animals, and other organisms that occur over large areas and that are characterized by distinctive biological structure, especially by characteristic growth forms (e.g., trees, shrubs, or grasses on land; corals, kelp, or mangrove trees in aquatic environments).
The biomes are large geographic areas recognized by their distinctive biological structure—
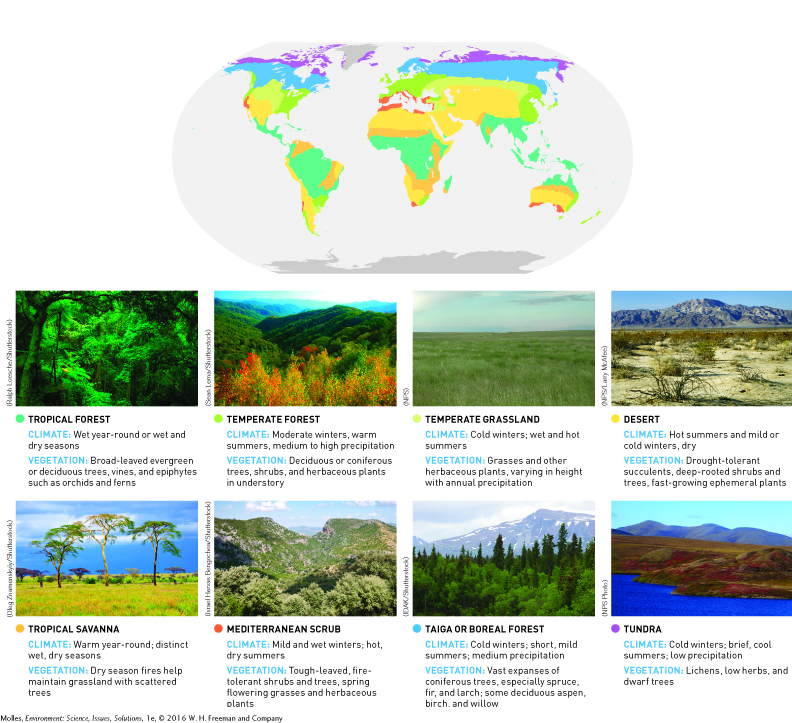
As we will see in Chapter 7 (pages 193 and 195), the soils of the terrestrial biomes are also distinctive and support very different types of economic activities: Temperate grasslands support extensive growing of grains, such as wheat and maize, whereas the boreal forests support vast wood harvesting for lumber and wood pulp for paper manufacturing.
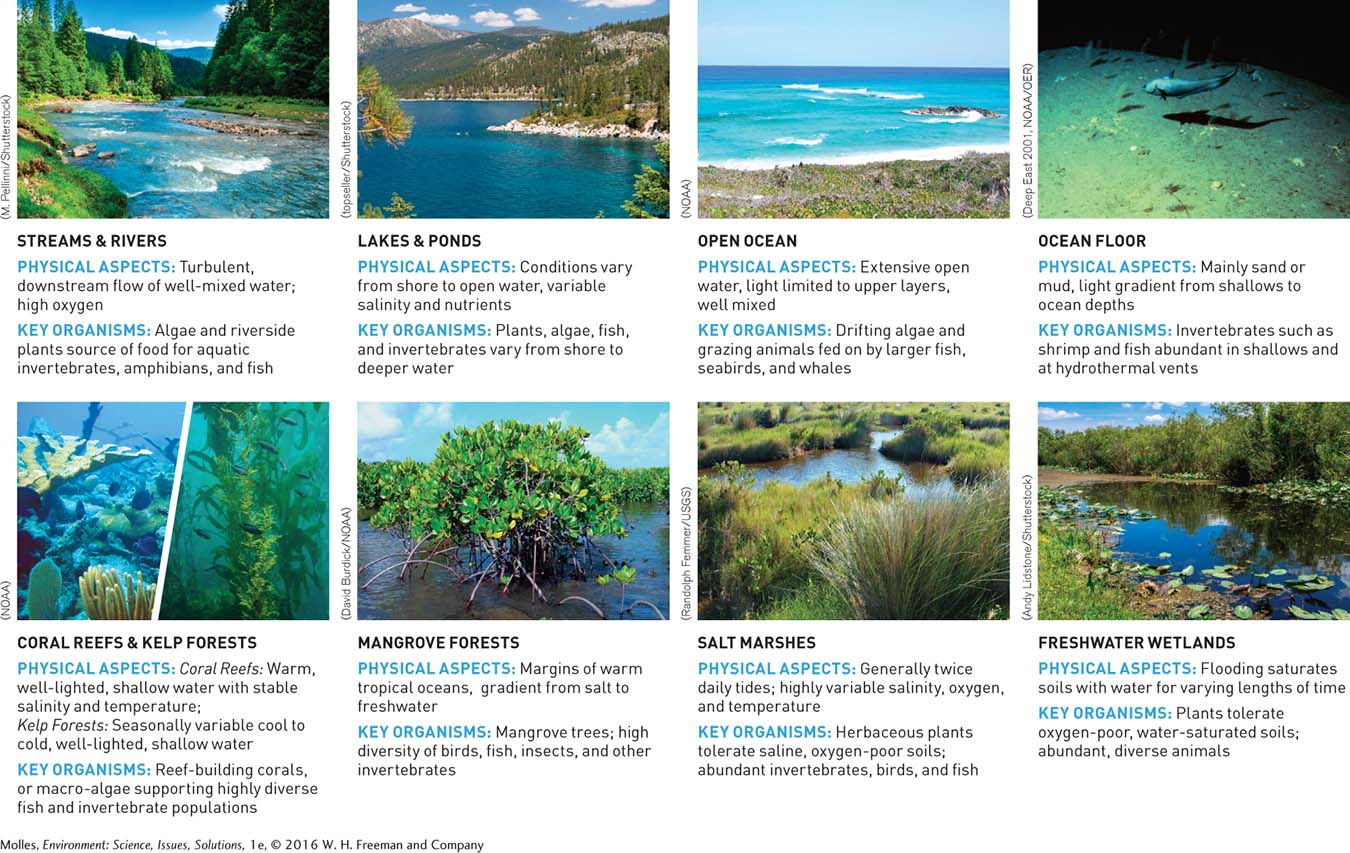
The Aquatic Biomes
The major marine biomes include the open ocean, ocean floor, coral reefs, and kelp forests (Figure 4.4 on page 100). While coral reefs are limited to warm tropical oceans, kelp forests are found in cool-
Latitudinal Diversity Gradients
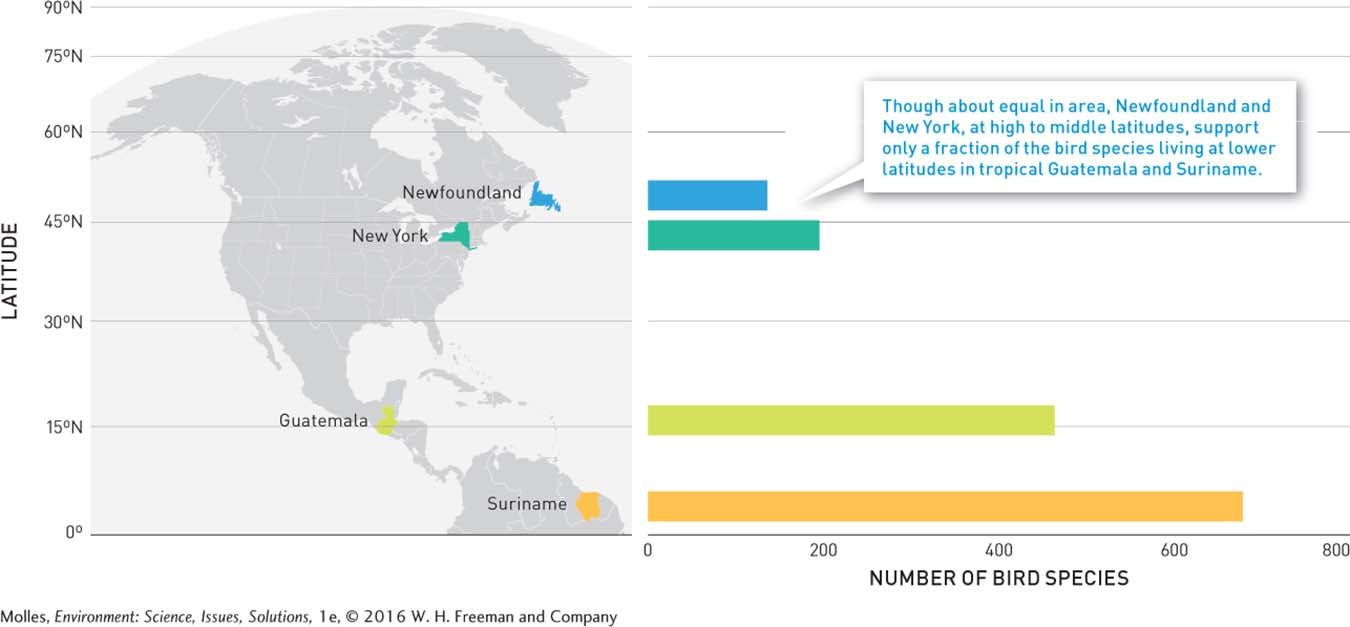
Consider that the number of bird species living in tropical Suriname is over 7 times higher than in Newfoundland, although they are roughly the same size (163,820 km2 versus 111,390 km2). Other groups of organisms such as mammals, trees, reptiles, fish, and insects also increase in species richness from the poles to the tropics. Similar increases in species richness occur among freshwater and marine organisms, such as fish, mollusks, and algae. As a consequence, regions near the equator contribute disproportionately to global species richness (Figure 4.5 on page 101).

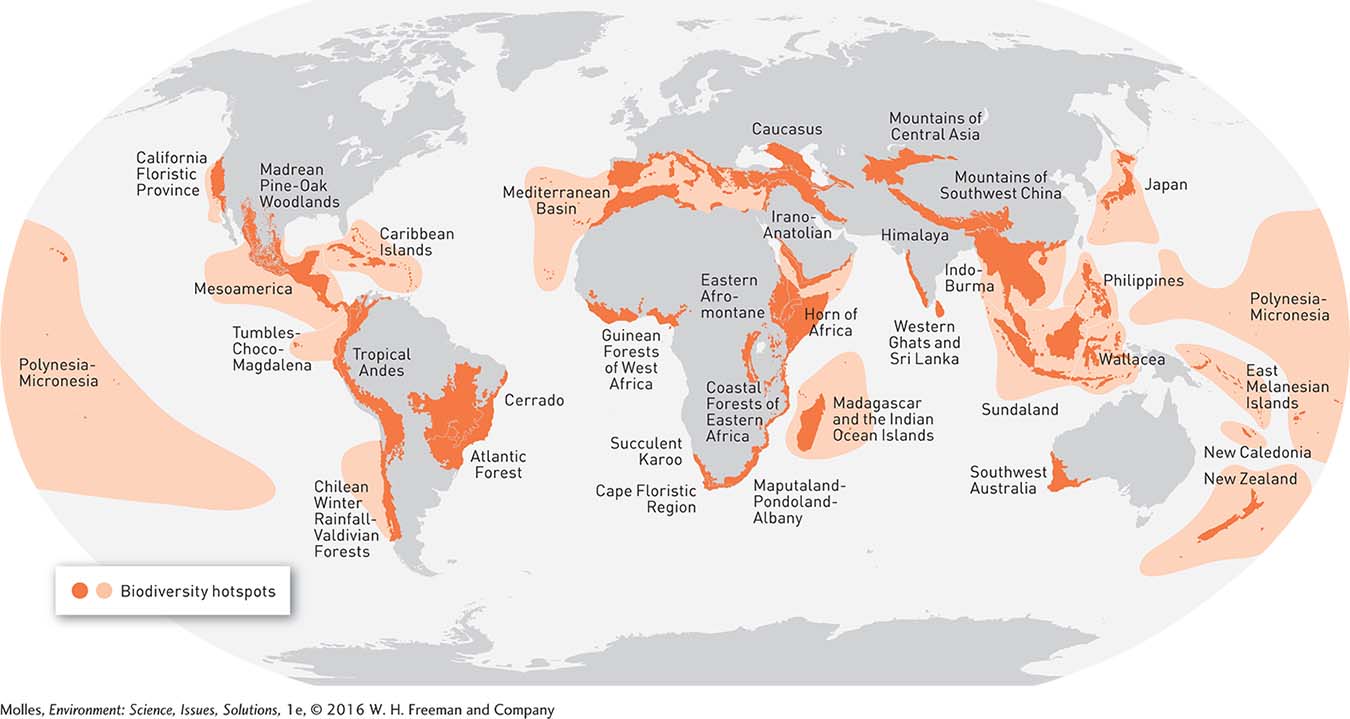
Where would species unknown to science most likely be found?
Why are the tropics so diverse? There are a few possible reasons for this phenomenon. The simplest is that there is simply more room in the tropics. The continents are centered around the equator, and the amount of land area there exceeds that in temperate regions. Other factors may include the amount of sunlight that the equator receives year-
Biodiversity Hotspots
biodiversity hotspot A region that supports at least 1,500 endemic plant species, approximately 0.5% of the world total, and that has been reduced in area by at least 70%.
endemic species Local or regional species of organisms found nowhere else on Earth.
Although the tropics are generally the most diverse parts of the globe, particular areas seem to be “biodiversity hotspots,” with spectacularly high numbers of species. Conservation International, a nongovernmental conservation organization, has identified 34 biodiversity hotspots on Earth, which they define as regions that have been reduced from their historic area by at least 70% and that support at least 1,500 endemic species of plants—
Species Richness on Islands: Effects of Area and Isolation
equilibrium model of island biogeography The hypothesis that the number of species on an island is determined by a balance between rates of immigration of new species and rates of species extinction on the island, where rates of species immigration and extinction are determined by island size and isolation from sources of immigrants.
Islands are natural laboratories for the study of biodiversity. For instance, biologists Robert MacArthur and E. O. Wilson proposed that the number of species on an island remains relatively constant over time but that the composition of species on an island changes. According to their theory, known as the equilibrium model of island biogeography, the number of species on an island is the result of a balance between the rate at which new species immigrate (arrive from somewhere else) there and the rate at which species already on the island become locally extinct (although they may persist elsewhere).
Let’s look at an example. The birds on Delos, a small Greek island of only 6 km2, were surveyed during the middle of the 20th century and then again 35 years later (Figure 4.7). Between surveys, three bird species became extinct on the island, while two new species immigrated. The result was an insignificant decline in the number of bird species from seven to six. The bird community on Delos supports the theory proposed by MacArthur and Wilson.
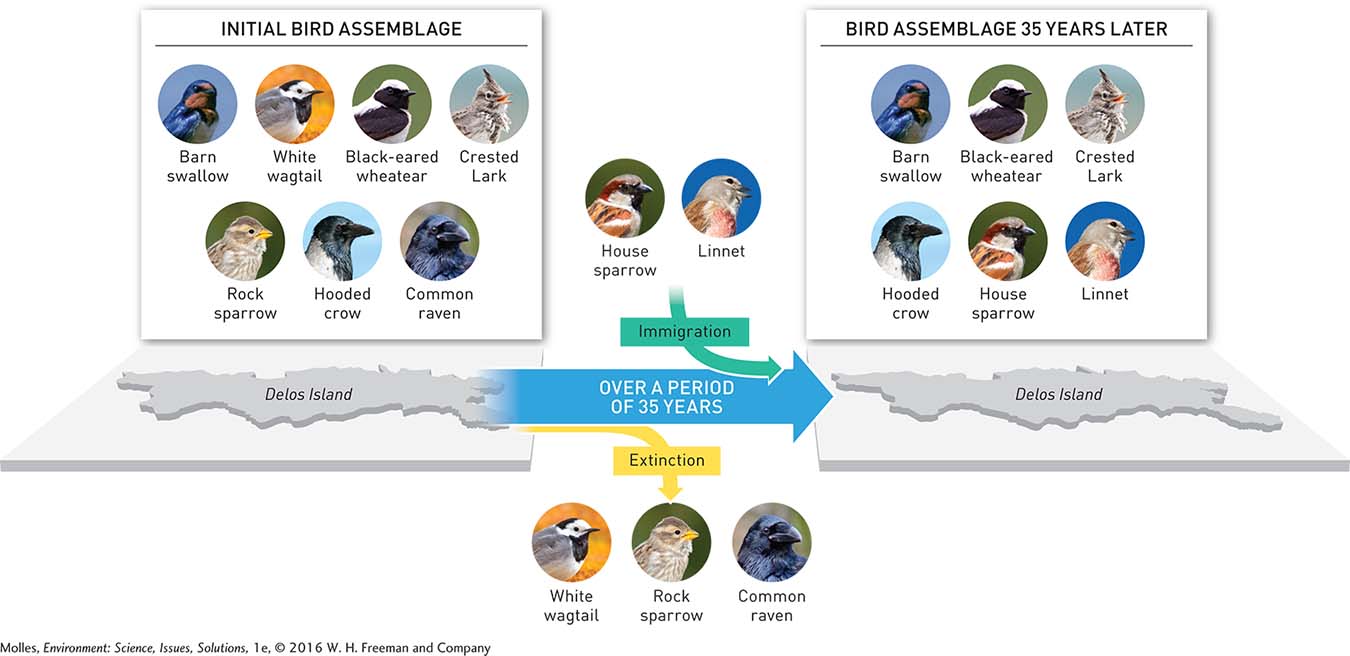

If you were to study the bird community on Delos Island 50 years from now, what would you expect to find?
MacArthur and Wilson proposed that the area of an island and its distance from the mainland source population determine rates of immigration and extinction. Larger islands tend to have higher species numbers for two reasons. First, they provide a larger target area and therefore receive more immigrants. Second, they have lower extinction rates because they can maintain larger populations of resident species. Now consider islands that are close to the mainland. They receive more immigrants because of close proximity. They also have lower extinction rates because immigration can help sustain the population of a species. Consequently, large islands close to the mainland tend to harbor the most species, whereas small, isolated islands harbor the fewest (Figure 4.8).
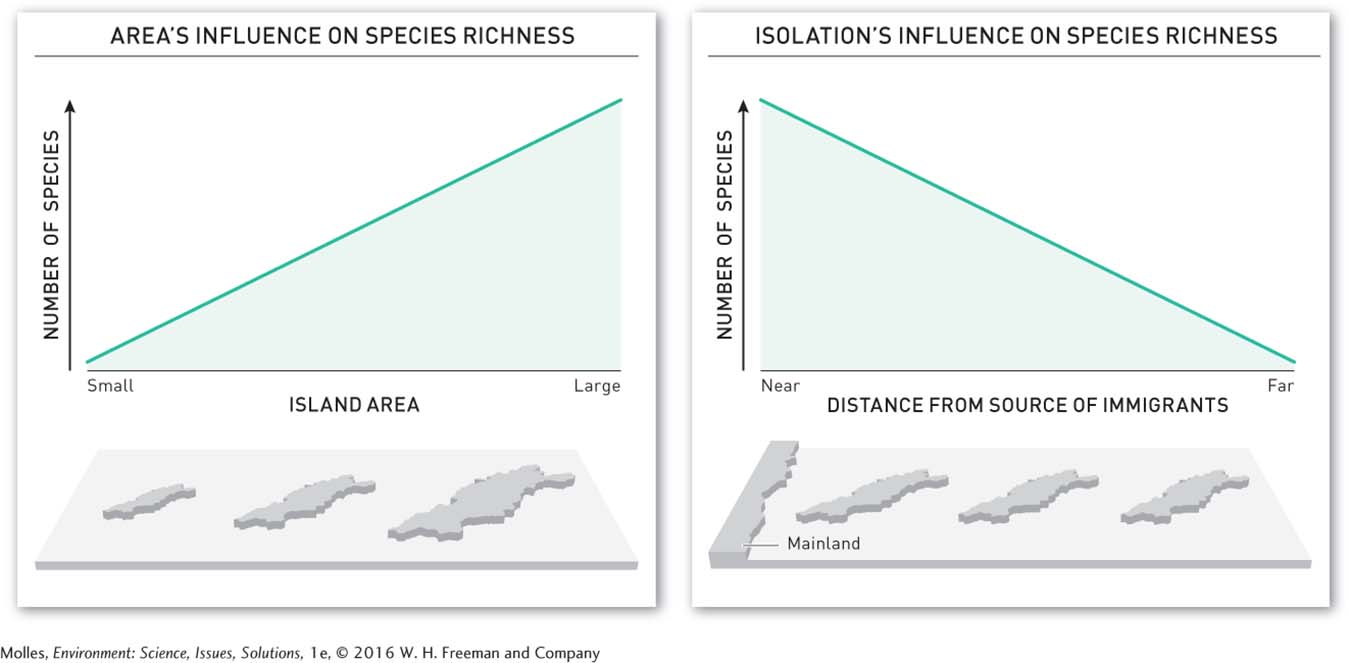
The equilibrium model of island biogeography can be broadly applicable to any habitat that occurs as isolated patches, such as remnant patches of woods in a landscape that has been cleared to establish agricultural fields or national parks or wildlife refuges, surrounded by intensively used forest or grazing lands. The implication of the equilibrium model of island biogeography is that larger and less isolated natural habitats will support higher species richness.
Think About It
Why do some conservation organizations, such as Conservation International, suggest that conservation efforts be concentrated on biodiversity hotspots?
Why is there more general concern about deforestation in tropical forests, such as those in Suriname, compared with boreal forests, such as those of Newfoundland?
Are there unique species and ecosystems that will be lost if we focus conservation entirely on biodiversity hotspots and tropical latitudes? (Consider the polar bear.)