5.3 The age structure of a population gives clues to its growth or decline
You may have heard that the U.S. Social Security system, which provides support to retirees, is under threat. How is it that every working member of the population is required to give part of his or her salary to Social Security, but the fund is still running dry? The answer comes back to demography. Because people are living longer and having fewer children, the number of workers supporting retirees has been decreasing over time. In 1960 there were approximately five workers for each person receiving Social Security benefits. By 2005 the ratio of workers to beneficiaries had fallen from 3.3 to 1, and demographers predict that the ratio of workers to beneficiaries will fall to 2:1 by 2060. Today, about 12% of our population is over the age of 65, but by 2080 that number will almost double. The only way to pay for these retirees is to increase taxes on the working, decrease benefits for retirees, or reduce the number of retirees by raising the retirement age.
age structure The proportions of individuals of various ages in a population; the relative proportions of individuals of reproductive and pre-
As you can see, demography is critical to planning for the needs of any population. In an aging population, that could mean Social Security and elder-

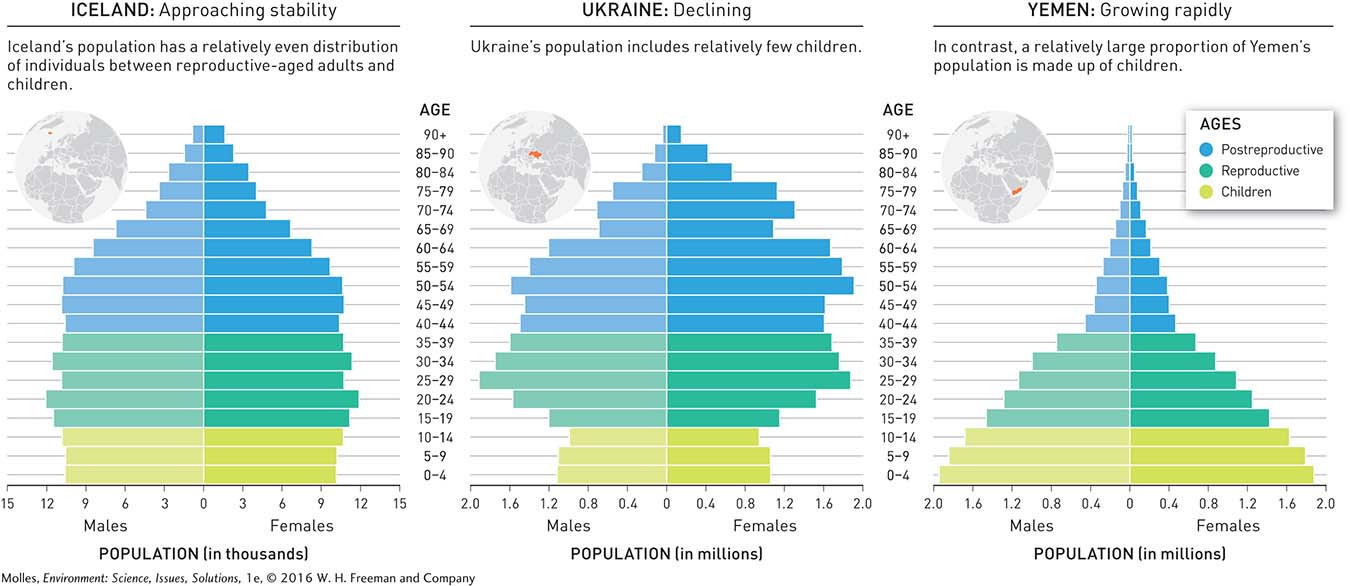
Imagine visiting a city in Iceland, Yemen, or Ukraine on a festival or market day, when a cross section of people is on the streets. Given their contrasting age structures, what would be your likely impression of each population?
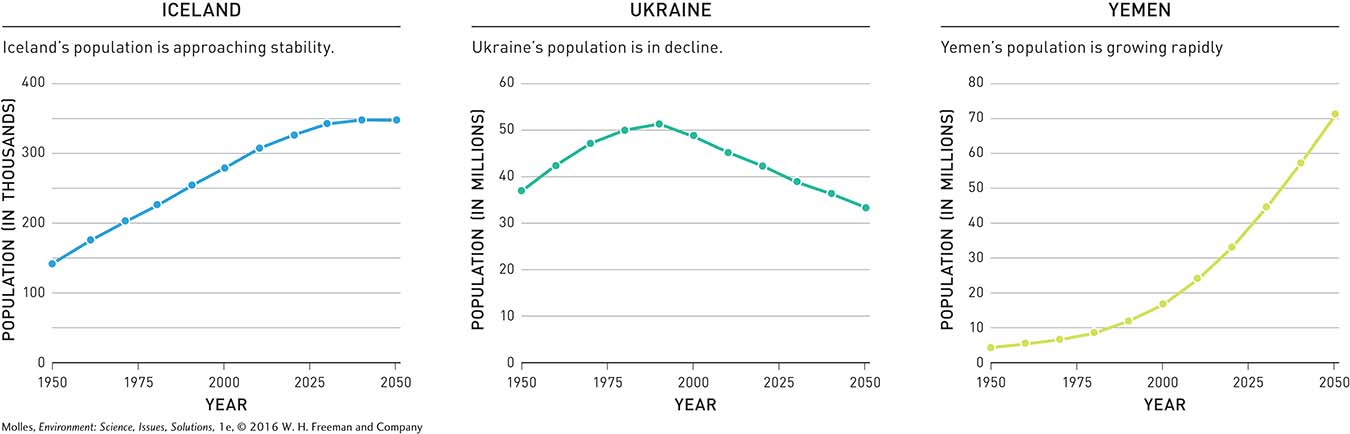
Contrasting Population Trends
One way to predict growth trends is to compare the relative number of children in a population with the relative number of reproductive-
total fertility rate An estimate of the average number of children that a woman in a population gives birth to during her lifetime.
replacement-
The total fertility rate required to sustain a population at its current size, which varies from approximately 2.1 births per woman in the more developed countries to 2.5 or higher in the least developed countries, where mortality rates are higher.
The contrasting age structures of Yemen, Iceland, and Ukraine result mainly from differences in total fertility rate, which is an estimate of the average number of children that a woman in a population gives birth to during her lifetime. A fertility rate of fewer than 2 births per woman tells us that a population is not at replacement-
Population Trends in the United States
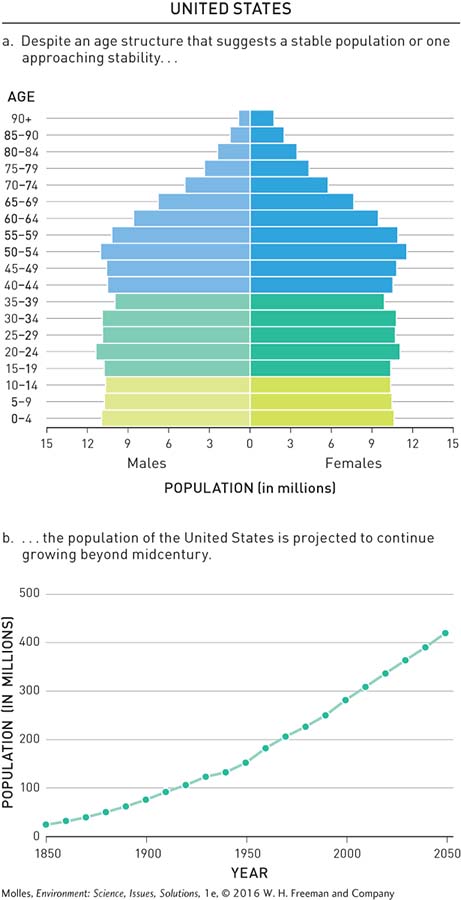
With a replacement-
population momentum
Population growth as a consequence of a large number of women reaching childbearing age.
The tendency of a population to grow even though fertility has fallen to replacement levels or lower is called population momentum. A lag period occurs because a large proportion of individuals remain in their childbearing years, most of whom will still be living long after their children are added to the population. In 2015 the annual birthrate per 1,000 individuals in the United States was 12; the death rate was 8 per 1,000. Population momentum in the United States will eventually stop once the birthrate equals the death rate, but it will be especially significant in a nation such as Yemen (see Figure 5.4), which has a large proportion of children in the population. The same is true of almost all the countries of sub-
Reproduction at replacement rate should eventually cause the U.S. population to stabilize—
Think About It
Immigration accounts for some of the projected population growth in the United States shown in Figure 5.6. What contribution does immigration make to the projected growth for the world population shown in Figure 5.3?
5.1–5.3 Science: Summary
After thousands of years of relatively slow growth, the human population began to grow rapidly during the past 500 years, mainly in response to increased food supplies and improved sanitation and health care. Population density, which varies around the world, results from a dynamic interplay between rates of birth, death, immigration, and emigration. Demographers predict that the global population will begin to level off sometime during the mid-