9.4–9.6 Issues
In the aftermath of the Deepwater Horizon oil spill, the United States has not shied away from the environmental risks from oil drilling. It has redoubled its efforts. In the last three years, oil production has increased by over 30%, and, in 2014, President Barack Obama signed a bill to reopen the Eastern Seaboard to offshore oil exploration. There’s even talk of lifting the nation’s four-
9.4 Global energy use grows as energy shortages loom
The global economy is powered by the extraction of raw natural resources and a steady supply of cheap energy. But what if the flow of energy begins to slow and the prices rise? Because we obtain most of our electricity from nonrenewable resources, it’s crucial to examine how much longer those resources will last.
Global Energy Consumption
Cell phones, laptop computers, and other electronic devices were formerly reserved for the wealthiest members of society, but today we see cell phones in some of the most remote corners of the globe. This spread of technology—
primary energy A form of energy that requires only extraction or capture for use (e.g., coal, crude oil, wind).
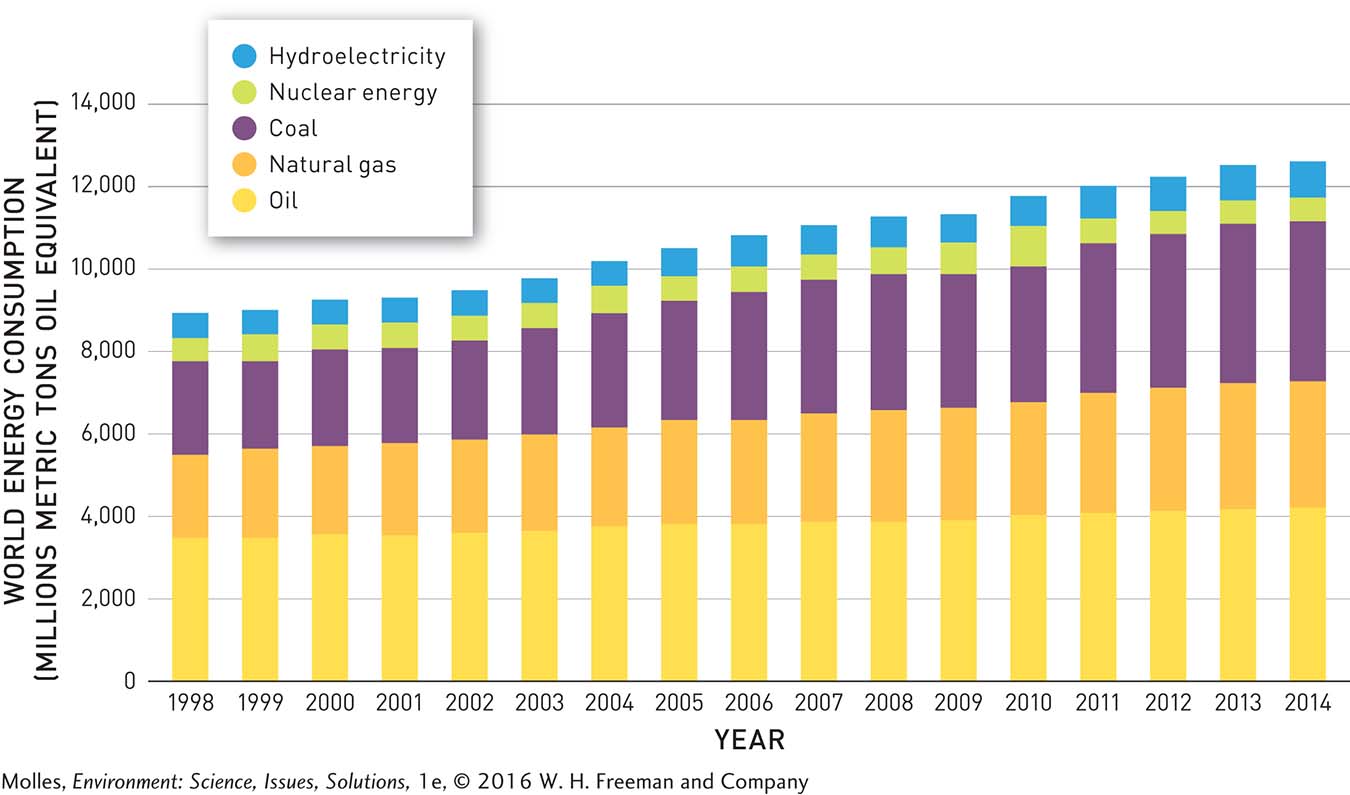
So it shouldn’t be surprising that, with increasing development around the world, global consumption of primary energy—mainly, coal, oil, natural gas, nuclear energy, and hydroelectricity—


What factors likely contribute to oil’s falling share of total energy consumption?
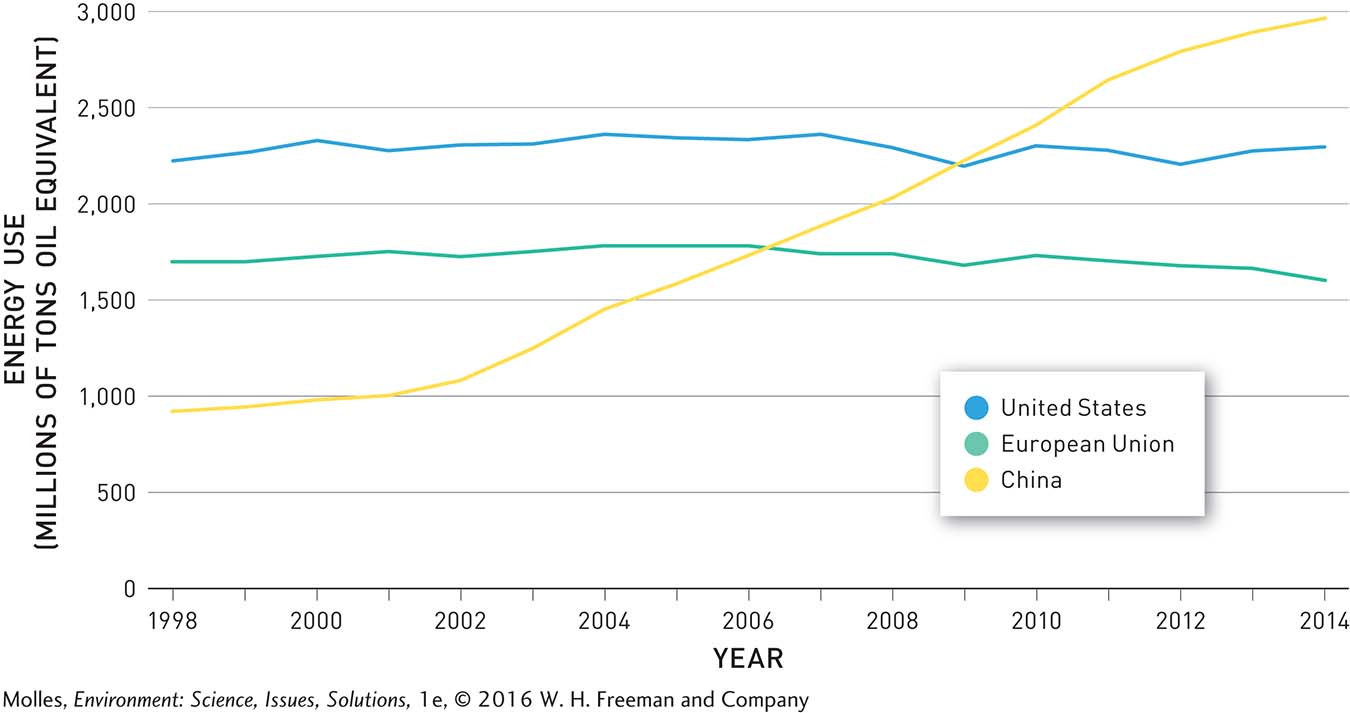
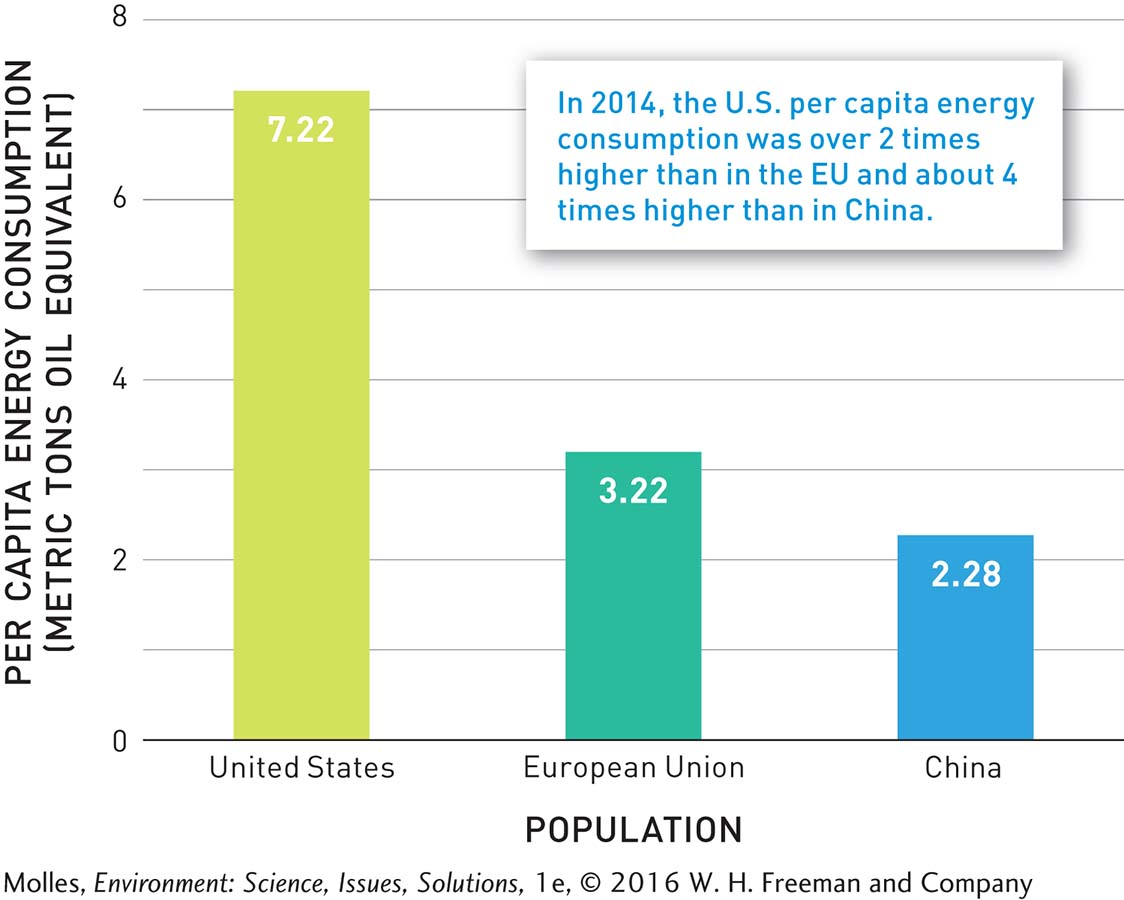
Today, China, the United States, and the European Union are the three largest consumers of energy on Earth. In 2011 their combined primary energy consumption made up over 53% of the world total. However, their trajectories in energy use over the period of 1998 to 2014 differ dramatically (Figure 9.19). While energy consumption in the United States increased by only 3% and in the European Union it declined by 6% over this period, the consumption of primary energy in China increased 217%. China’s energy use surpassed that of the European Union in 2007 and the United States in 2009, making it the world’s largest consumer of energy. On a per capita basis, however, people in the United States are by far the heaviest users of energy (Figure 9.20). In 2014 per capita energy consumption in the European Union was less than half the U.S. rate, while China’s per capita rate was approximately one-


The U.S. Energy Information Administration predicts that the world’s demand for energy will increase by another 35% in the next two decades due to economic growth in developing countries—
Peak Oil
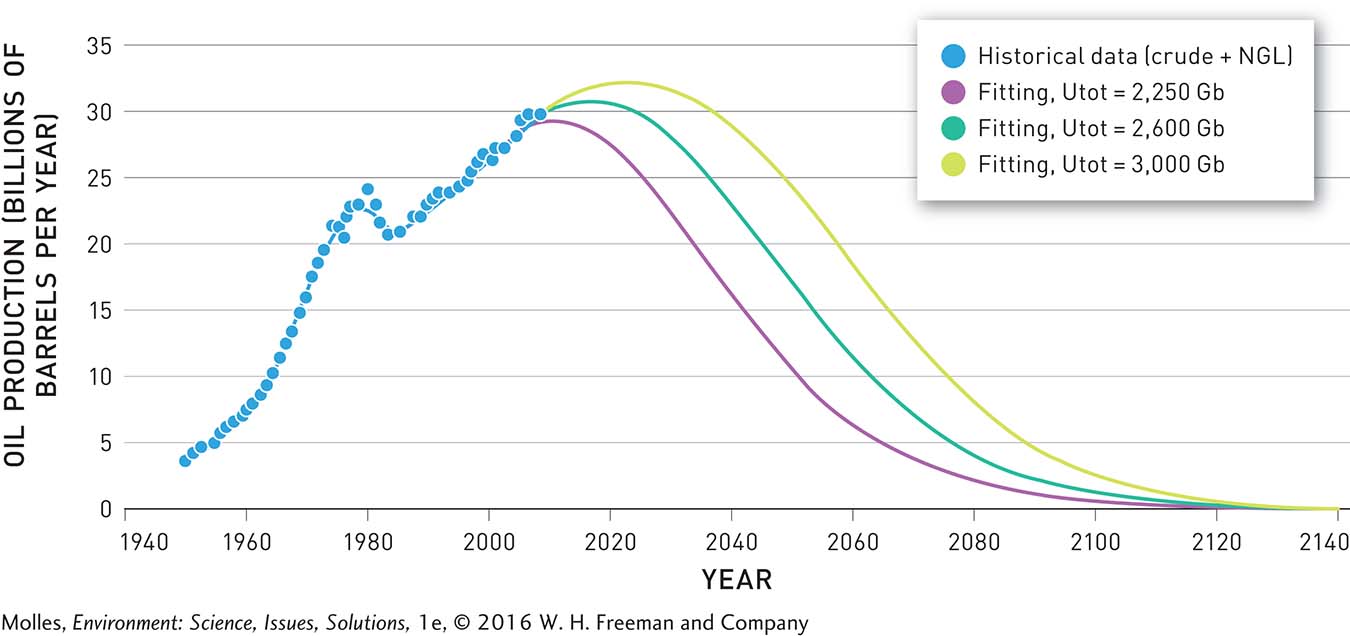
In 1956 a geophysicist named Marion King Hubbert, who worked for the Shell oil company in Houston, Texas, began to wonder when the planet would run out of oil. He had devised a theoretical approach for predicting the future production of oil based on past production and the rate at which new discoveries are made. By applying his theory to oil production in the lower 48 states of the United States, he predicted that production would reach its peak in 1970 and decline afterwards. He was ridiculed at the time, but today we know that he was essentially correct: U.S. oil production crested in 1970 with 9.6 million barrels of oil per day. After a 30-
Although the United States may be the world’s largest oil producer, it still accounts for just 12% of global oil production. Hubbert estimated that peak global oil production would occur in 1995—

Whether global production peaks before 2021, 2050, or even later in the century, the global economy is near a peak in oil production. As we will see in this chapter and in our discussions of climate change in Chapter 14, there are many environmental reasons to reduce our reliance on oil and other fossil fuels. However, there are also significant economic reasons why governments and companies will want to reduce their dependence on oil. Oil prices increased from $15 per barrel in 1998 to over $140 per barrel in 2008. While the global economic downturn of 2008 led to lower oil prices, they were back to more than $100 a barrel by 2012. Oil prices fell again in January 2015, reaching less than $50 a barrel. But in the future, after production has peaked, demand for oil will drive up the price, potentially to unprecedented levels.
Other Peaks
Hubbert’s approach has been expanded to estimate the peaks of other fossil fuels, including peak coal. According to the Energy Watch Group, peak coal production could come as soon as 2025. Similarly, natural gas production is expected to peak and begin declining around 2020. Uranium production peaked during the Cold War in the 1980s, and is expected to peak again around 2020, according to the International Atomic Energy Agency. In the absence of new nuclear technologies or the discovery of new uranium reserves, uranium resources will be depleted by the end of the century.
Think About It
How much would China’s (population ~1.3 billion) total energy consumption have to increase for its per capita energy consumption to equal that of the United States (population ~300 million)?
Why are we unable to predict precisely when peak oil will occur?