Chapter 1. Introduction to Graphing Skills Tutorial
Part A: Variables
The core of science consists of gathering evidence using observations, experiments, and models to test hypotheses.
The scientific process begins with an observation made by the senses or extensions of them such as telescopes and microscopes.
Scientists will use available information to form a hypothesis, or explanation of the observation.
Once the hypothesis is proposed, a series of procedures will be developed to test it. This is called the experiment.
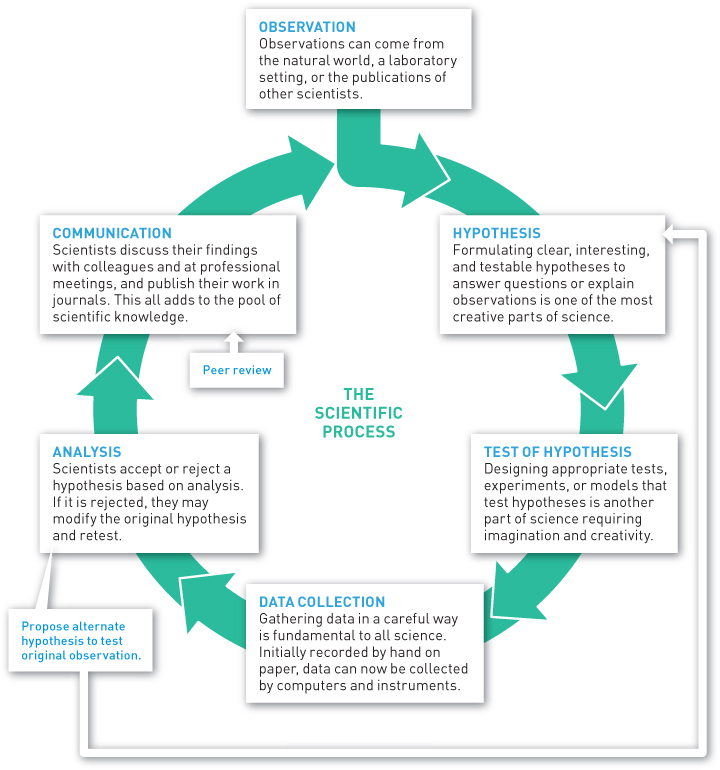
Computers and instruments will be used to collect data from the experiment.
The data will be used to draw conclusions relating to whether or not the hypothesis is supported.
Part A: Observations
Observations can be qualitative or quantitative.
Qualitative observations are descriptions that do not involve numerical values, such as color or shape.
Quantitative observations are numerical measurements, such as mass or temperature.
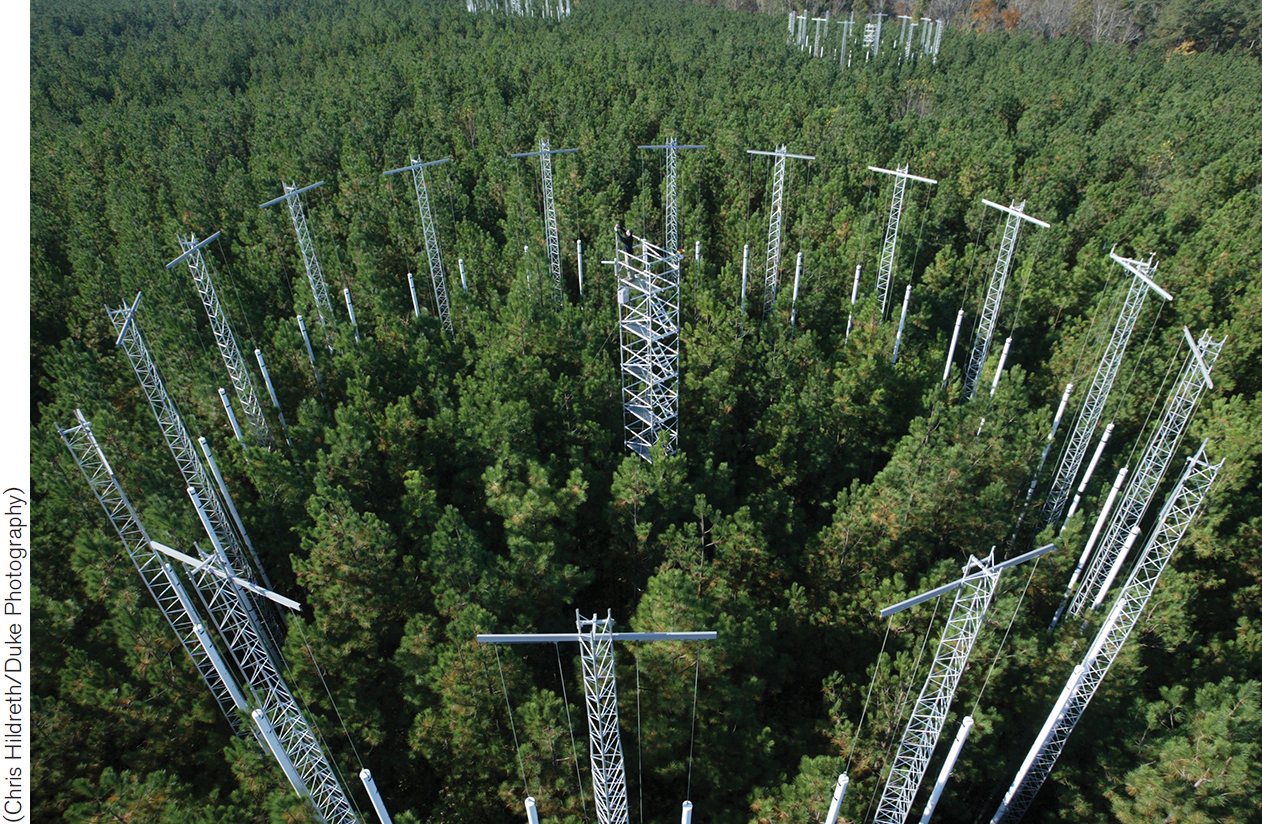
Scientists observed increases in the mass of loblolly pine trees when they were grown in greenhouses containing elevated concentrations of carbon dioxide.
Question 1.1
yOcvsQBkZQvpt3sfMLpAlWOYsY0I0/GI6rAW1why6r8rugBGaHYONsFNm+RFa+rrnJWMG/b40M6Yt2+BXPXUF/CE2EWXAiBtRj7d1imnl8gFwMeW7nppES2TVZMbO2rP/3DoUgPjAVe+Pcc0oqLY5O4+Gi923tL7M7OG7IjwGhZ0u34VqGZb1txYj50=Part B: Types of Experiments
In laboratory experiments, scientists attempt to keep all factors that influence a system constant, except for the one they want to test.
In field experiments, scientists will again manipulate a single variable, while allowing all other factors to vary as they would normally in nature.
Question 1.2
aENCxpA7jPKHw8CFT/imnFuEOqLoEHRGbJj1yV1c2XxZg2ZtI55vyr2heNKCTuHxEr+GoewXDjSS6IMjKGO52sQD3pG81MDYnDYFIYlYQqlIIcq4TTV0L7p0r+oNc1x9pCeSqezY2uuE8AqNNUZVWT/KKwrV4skXazs3DNwIAAg4bg86rNwGeeJjNFEfOO8e0kMdKAySU9eWcz3b11riwZx/kJ0PX9PoEgOd09rShczyjH9gAFft4qbE34qKLef57ex5M9gBpqrDHk4vk59HjuLErONvH/c5lr88wt1k/f6F57jl+Llg4YGRHZxbxrvGzug23WqTsahNBTK1kFyAwYxbwAaEZHkRAAjO4DJKHtSpTRi9lXyn3Y4jtVf0lHp7EmkBkMXeHuQsUyQuBoth types of experiments will often implement a control group into their experimental design. Control groups are not exposed to the independent variable and serve as a basis for comparison.
Question 1.3
uMGr9bU1TB7sgMnBd4Ak46VwMKwPJxTsmtLbmYi1RQt216+3V0Qv1SOy2i05bAmygIEGUpA8T5Qz2UKrrH/Rdz7TwNY3QZ6zbMPzSBU35fj+h24TPq5I4L68jcveg/kTP6lNtyb8yTR3lHWpEey2s6erLCnTfFaptsLSiltEAbXlMonmTS+T+QE3qB0mnNgMmoLR41xvXB/xRXPce3UvSbP70doI6hQ8tqxoUWi179ghY/EY9GtBcnfWV5GjDsujQ82lbch8EBlGeJB76zExz5ky+QYSIoDlRGsVokNwLZDSrp1pVkm5nWfb9g01kaGjd2M3ussTUo9LtslaoAm5RYA9DPEcCNVPiHdB9x4Vg79WZPkKPart C: Variables
The factor that is manipulated by scientists in either laboratory or field experiments is called the independent variable. This will in turn cause changes in the dependent variable, which scientists will measure as data. Controlled variables will either remain constant, as in laboratory experiments, or allowed to vary naturally, as in field experiments.
In the Duke University Forest experiment, the scientists wanted to see the effect that the CO2-releasing towers would have on CO2 concentrations in the soil, plants, water, and leaf litter in the ecosystem compared to a part of the forest with normal levels of CO2.
Question 1.4
EpuoYjT9Bp+COJaU+ozfzVCQWYjt4L2EpT+pnKRKa8megWECAfazIwdwO9D3f76jT0rdTvZdFFZjTSvlEXXpLJ0/GK7ddg+1x96LSWzK6UoHHeNmIZQ0uDmJcOGERPaA1WbvLkkno4rLldsjutkAUH9X53KZckOvos0T55E+GxxyHeAbxeJzGdy/FDsniEb0xkQQ3pDbhazJs97MHrzhmg4NHfq69ykw3foKZb++iG0SPh+JugPQCQUTxlUyT1TljL8/uMoBJWFRfQidqxJZdLOaSyP/i/90KvoFEuNQgINhc2urd8zjNQ8uW371BX8ERqW06QOKCimugVMCH4dJto9xS4t3V9dG/yimlNpmY5yG7I7ruF0EWGsQ+YL0PzpOMBhWh6Y7Wagv4th44btHzA==Question 1.5
3jbfQovgsyxE8YBPD6sqjAd60hNRh5MFt6tf12yEwizHgZfpdOJv/9VaCmdi486GiQUTRZcPM/p2IswaSDh6SdovzK/vyUA5tRn7CRcvNcEjFEsdpqVzmVfCjkrFi3qsSEJMo/bAsNrPim93Qvxb3Dk8my4IfRd3yz+XA+XW0xxKHWmyO9FIbuvTP7hkQTQfh7VwLnnWfX15FTp1io3En8TfakDl3ZiyKE7Dwmlo8AhAe21kt/pKyr7vsrwwU0zFSWUJAtiS7GfzT0AeB1lW4LMBDtAneiswTvKIKnwPi/c1lrULMhQ2BA8a2vaoPY7RPQIFiojrSYeYMitf2lgRG2j/wd5Ep3vuC/EW/6GCwXq/4rUxV4QKyArDtWUiEAHbrpcbXoq/4lK2SkLJPart D: Apply Skills
Data tables are used to display the actual measurements taken within an experiment.
A descriptive title is written at the top, then the independent variable is displayed on the left-hand column, and the dependent variables are displayed on columns to the right.
Any relevant units (meters, grams, etc.) are displayed with each variable.
| Ecosystem component | CO2 concentrations in elevated CO2 plot (g/m/year) | CO2 concentrations in normal CO2 plot (g/m/year) |
|---|---|---|
| Plant stems | 505 | 397 |
| Forest floor | 130 | 78 |
| Soil | 89 | 89 |
| Groundwater | 21 | 16 |
Part E: Graphs
Graphs are a good way to represent data more visually. They can make relationships more apparent and easy to understand.
Graphs always should be directly based off a data table, displaying the same variables with the same labels.
Independent variables are placed on the horizontal, or x-axis.
Dependent variables are placed on the vertical, or y-axis.
Now, look at the data table from the experimental study.
| Ecosystem component | CO2 concentrations in elevated CO2 plot (g/m/year) | CO2 concentrations in normal CO2 plot (g/m/year) |
|---|---|---|
| Plant stems | 505 | 397 |
| Forest floor | 130 | 78 |
| Soil | 89 | 89 |
| Groundwater | 21 | 16 |
Question 1.6
RqGE+r5aqqKrxfSD1jH4yWeYOnxaVgr/Ivwg4+PXANKtxRvEpHLLlaXiL3HQE1ZVEuXbml/zOlZUIgjzMkzCWiNF1DAieObcuiYDHoOs29VQfyCNs8jXG5pNM+iZcA7JAfpC/tqoe+9885lhmHfow8DQdEj9vnKK9LgM2VdP/UZyCttPgy4a6XmH84ZiO9BbJMXckRjWr+N4qXYb7Cvsm2YdX099ThDumE07dipZ9KZXsfzHQuestion 1.7
UxiqGJ0Ut2p1DkTJ3nR92mEo8J3m/GqK4C8ZXcKww+GfL0fsrk1C2enJNnI3v5o8p2eaoBikqSznGjYmxrkEsIsLzslF9qHNp5Pk9U2zi822QR3rodB4/x1rglf29xkYFquwLlYex4hhAdOtjHons8Qo7iyOhMD45rsjcPuB4h8MX3dWOnXl0ZdaRzo9k0lIyX+ybHyqrNqi8O/eDnYj7YJ7UYIwVjXKPOfIdptHzCF1EEBG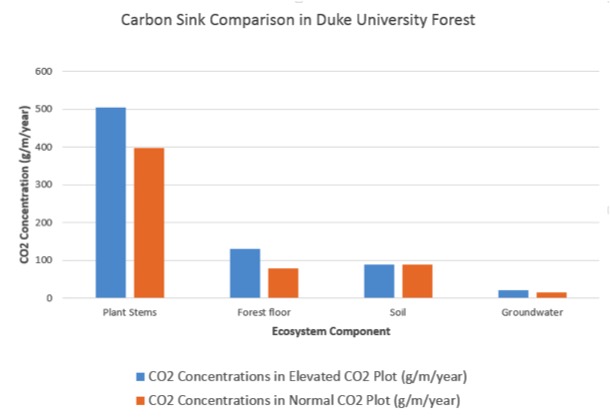
Part F: Types of Graphs
There are many different kinds of graphs that can be used to display data. Each is useful in different situations.
Bar graphs, such as the ones used in the Duke University forest study, are good for comparing amounts within data groups.
Bar graphs are sometimes displayed sideways. In that case, the x- and y-axis rules are reversed, but all other formatting remains the same.
Part F: Types of Graphs
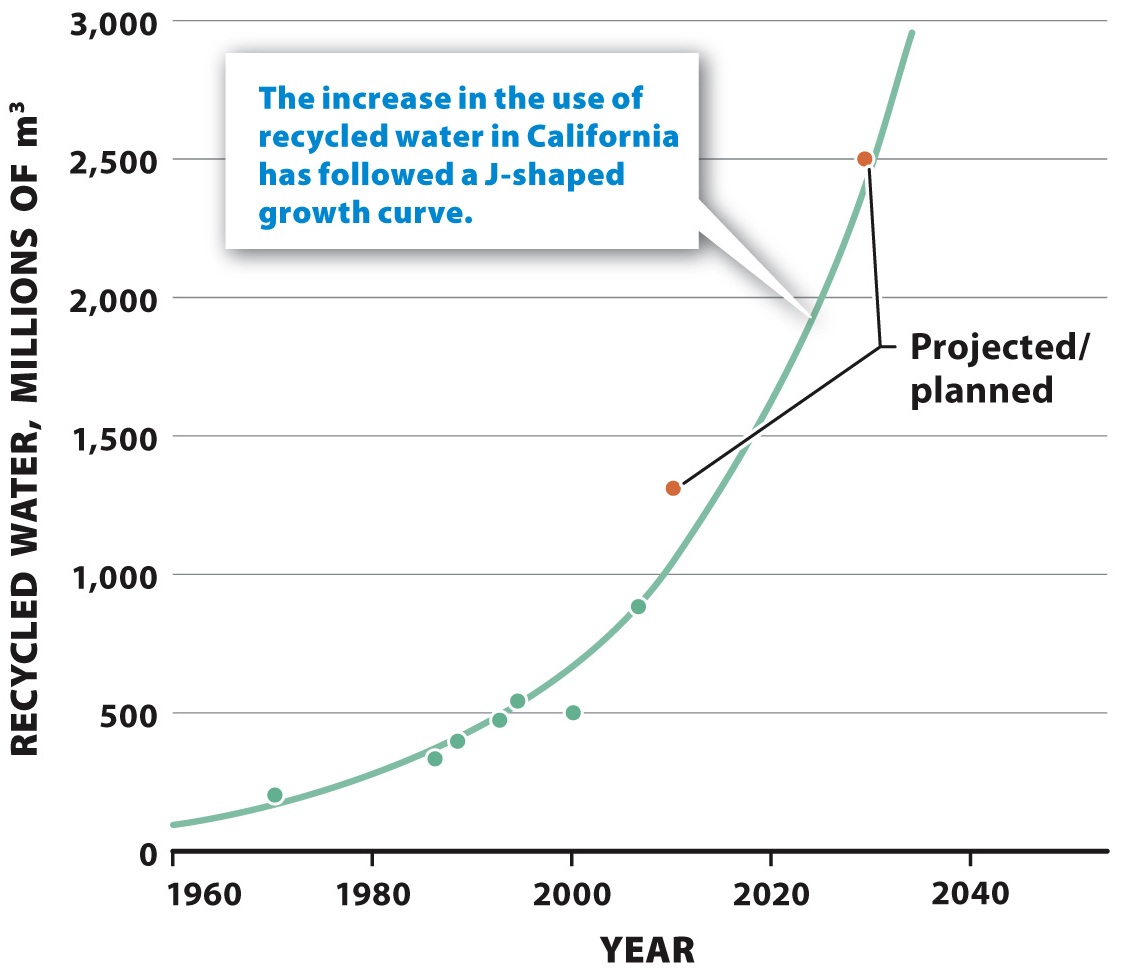
Line graphs show change over a given period of time for a single group.
This graph shows water use in California from 1960–2040.
Part F: Types of Graphs
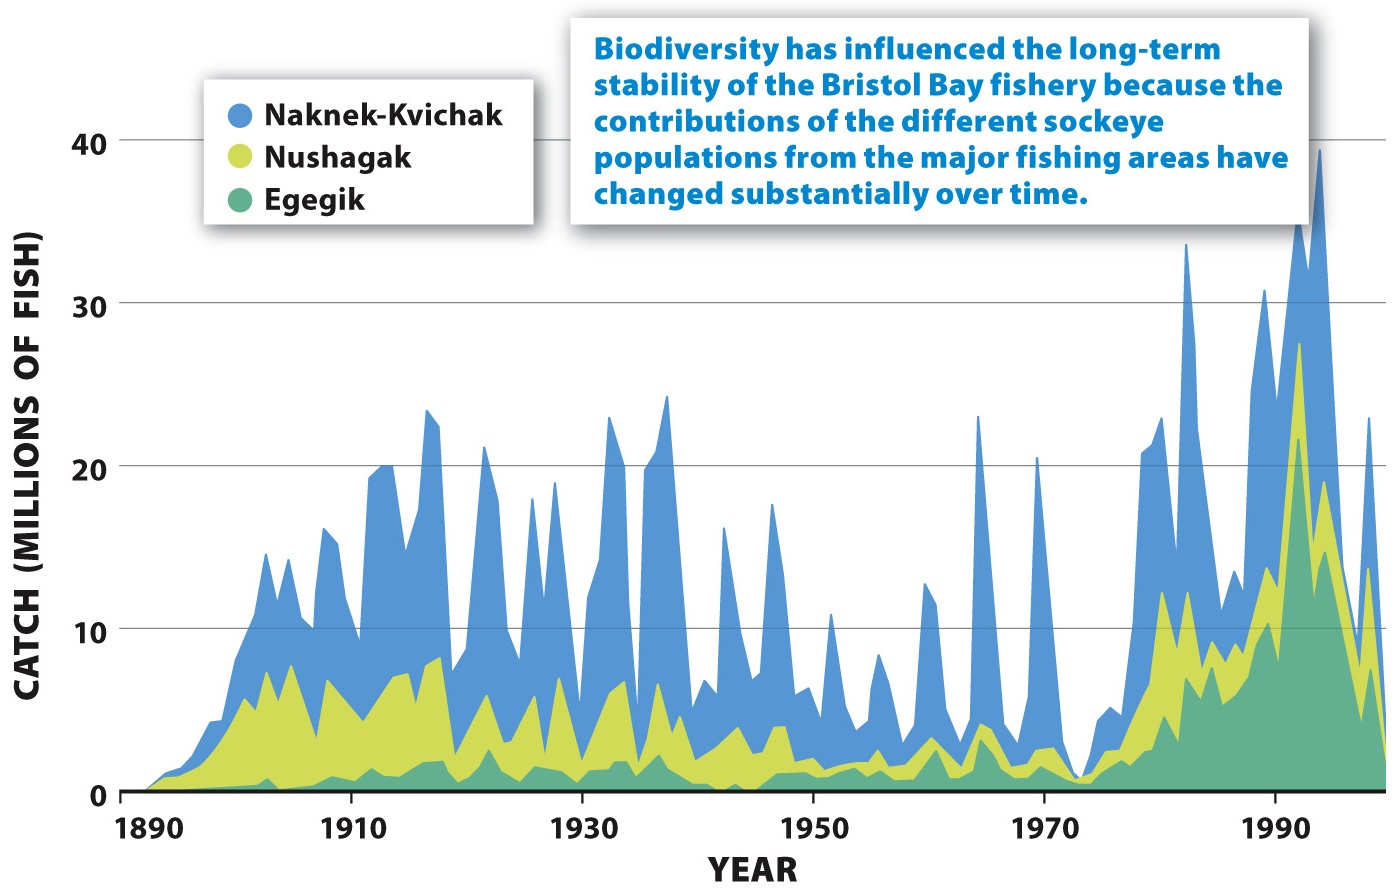
Area graphs compare change over a given period of time for multiple groups.
The area under each line is shaded in, indicating an amount of something.
As with line graphs, time is always the independent variable.
This graph compares the catch rate of sockeye salmon in three fishing areas.
Part F: Types of Graphs
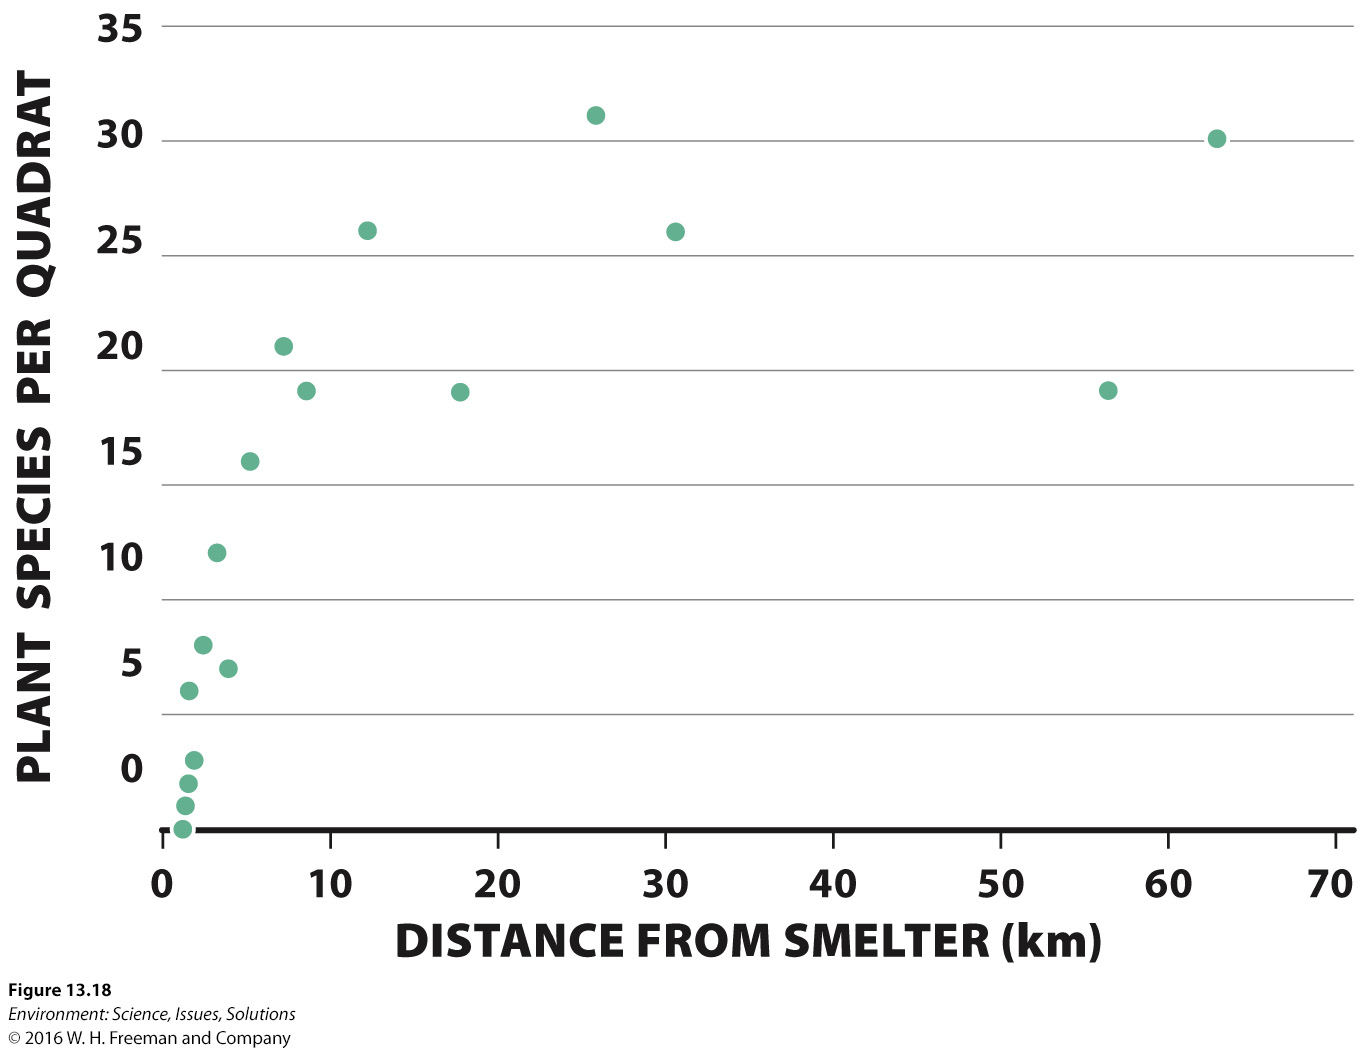
Scatterplot graphs are used to identify a possible correlation or relationship between two variables.
The points are not directly connected, as with a line graph.
Part F: Types of Graphs
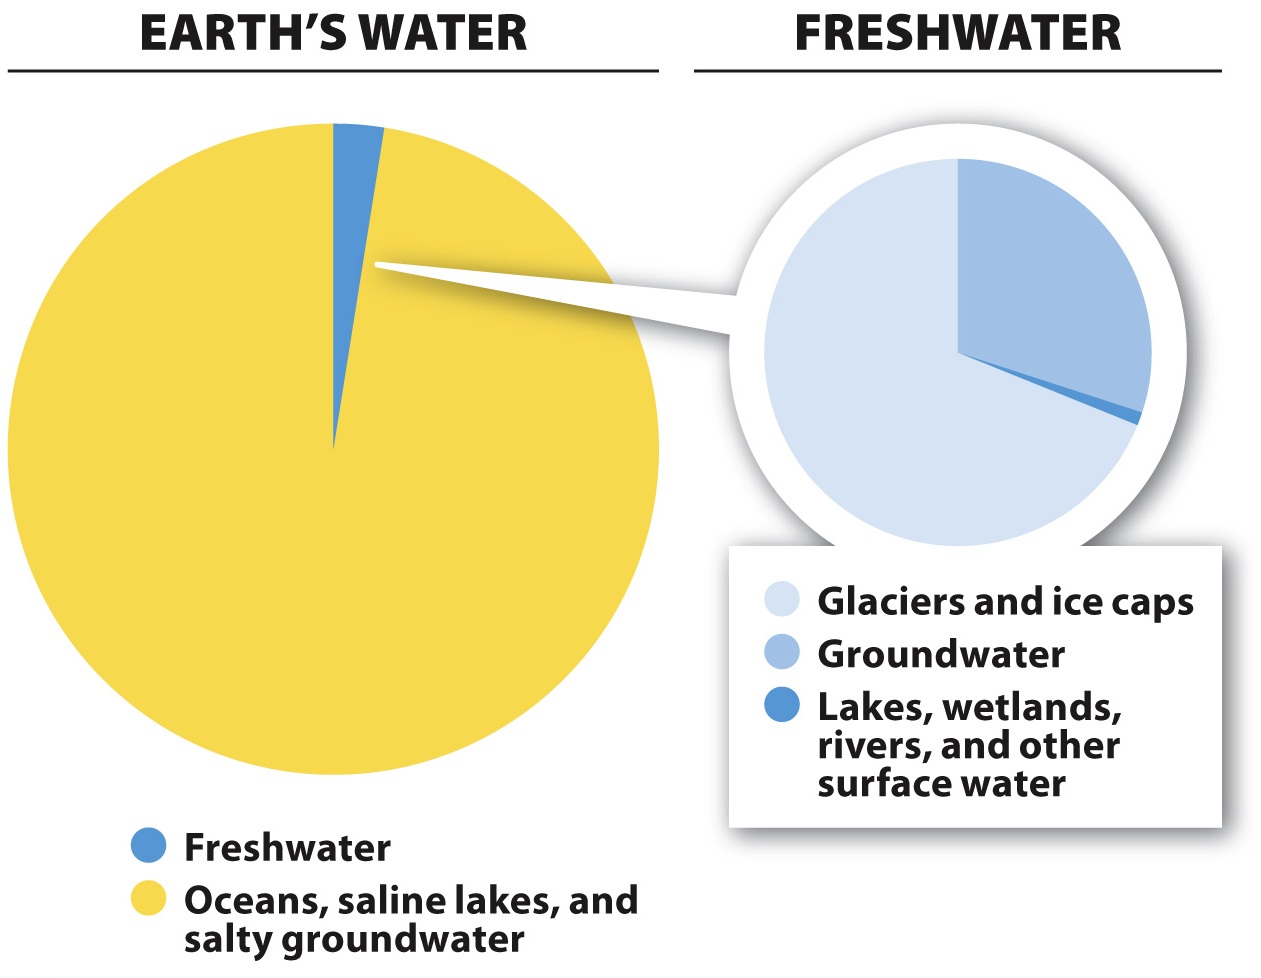
Pie charts compare parts or percentages of a whole. These are commonly used to describe percentages.
This graph shows the fraction of Earth’s water that is fresh or salt, and where the freshwater is located.
Review Questions
Question 1.8
pz45TjoSc0RNKbzb29W/JenbcW1rc2ilCkJ/tC3vDG+DWcE0+Y1c4cNjSbcPry4Pb7ljGzcEARYAj4RHiRk1SoAs2kXVdYt7FRUPLe84H7FYZ8lX5/+cRXLlCfsWbGvebv9kbn52piCyC/QoZdPprBpRK9sJCg5GASXQ+Adzi4IfrYDhFowlfRD1P0KU2ePLJuy0qTJxz134T0FLHRbnfkYP0l5eLORYoYI2qudHL+0M0LfHJ0PHf1572O7n+getywF+kCVyZANdXshfhk7tnFdIcI/7Ge3maoP/Zj5AuTdQDiGjVGWso3Qd4s1BIKD4kmCuV1T4M/z3e7srXRLLqg==Question 1.9
7IrJ4ZZvfFOlrfOBTQNItb89x88RffPs5MoOQuhQTfLI3xNj5mgDay3/uiSWLV7WgOXINke1OoqjD+AY0X5fCMqC7lY1N3mWT+F7NyQkAG+M0oAHd6FOsZp2qvBGe/OfKL38U7mrZpopLsWgcDiYkLaUgaIKi6efOOuNQ3FqoDc+vtbfYMcAQNk4+u9yyxl74q1+zwnh5l6y6NDBZsyldclucRoEO3VrUtt/DGfR5vvfhPhwePSmIvuGHvhErRMEM2apxGlmrT3mLtdGcSoDyNGQ7+bn+pu/RLxe+B1zwSV4PeVnoPkYlm8s/fYvZPtDcLNWIQ==Question 1.10
JbkhNyh9dywqbY0i2RfkXsIrdqsznI2MK9G3y4rGvSY6B/RmoW71nT7r/r6SMQWHmB1WYw6Pgr+Mu4HylQVg3DcCk1shOUbBJeNwEfPdttRCpGeBAd9+jL5xTqalQh8yqBXkNPviOqcwNfVN+uPBOSfqd1s/TO1isgBHxQiZyeONg1CT4EOzWzVOdChyqTfHodRv0uPcwHXEEDClSjmcCOehmEGVGRJDaFZN57OgwwpBycvB21KpzqIinA1P8yutOWpKJ1zlYSOhBrW4HiLlKL/k5tT+NIyVO/ew9IDlVfVIxR8M/TOJfvzEx/w/4ONNsEIA/klmrFgScH2gx+nCa3UgY415CwxvQuestion 1.11
FuJ8a44Pw4qnrNKZzsSKkk4f8v77yfvxqXQSrKy4M7CZ5x1i/8ygxaTF4qAY8zJrEMYm0kFn999qo/eesipxder5zGfz4wnaXz6Nuin+QHgUhZJ2LCeCxF75/nfMOH2/cTRAGl9lbDjB6NLknhUiRFvtnqvE8gZo93uFjKO0CiUWcrCTa/bbSITcrtqAty+RMamqYe2GNIcUHFmd8zYYsQnaqGmxXxKLouREQR43gnLhEByakqddaaZH4KAJv2EpWGOp74w1a8b6TaHiiqs/AAyND0nFMgyLFx9+zN49yheaUlRLTKzaJ2MXaVWf6RiyqIEZb4Y2V1aIFpkMKrTqlFXr/Wz5cIBWKCI7shErcpw=Question 1.12
7yNUarnCOcInE4bejMXFxMRdQeZlzu9ORejIVSCwoSLGf9rMeiS/h4UJ5Mdtv+4q3Z10Khnv1qCq5O9HtRrNfvO5ipAEHmiEDayVD3zj1BUEdzDB6V7YE0GL5BmyrgDbmw53RVMfNRl7w6LZQPDAGZF83Vep8Jg9JCk/DraxoKPh4omL4Sd6QvrcQVGLA1APJJh2FsGFWxTW2Ps7ZkHUEuFJ+jRAU+GxDYIOnZTTMKLor90WYicBiCzW//2L/3Fk4x3q6fwDLHHMZf6KxNImPR0nizDSVbCLuissMM/6/UMaiusMnB5qyXw2lHD/h1N41.1 Activity Completed!
Activity results are being submitted...