The principle of segregation was tested by predicting the outcome of crosses.
The model of segregation of gene pairs (alleles) and their random combination in the formation of a zygote depicted in Fig. 16.7 was Mendel’s hypothesis, an explanation he put forward to explain an observed result. Further experiments were necessary to support or disprove his hypothesis. The true test of a hypothesis is whether it can predict the results of experiments that have not yet been carried out (Chapter 1). If the predictions are correct, one’s confidence in the hypothesis is strengthened. Mendel appreciated this intuitively, even though the scientific method as understood today had not been formalized.
The Punnett square in Fig. 16.7 makes two predictions. The first is that the seeds in the F2 generation showing the recessive green seed phenotype should be homozygous aa. If the green F2 seeds have the genotype aa, then they should breed true. That is, when the seeds are grown into mature plants and self-
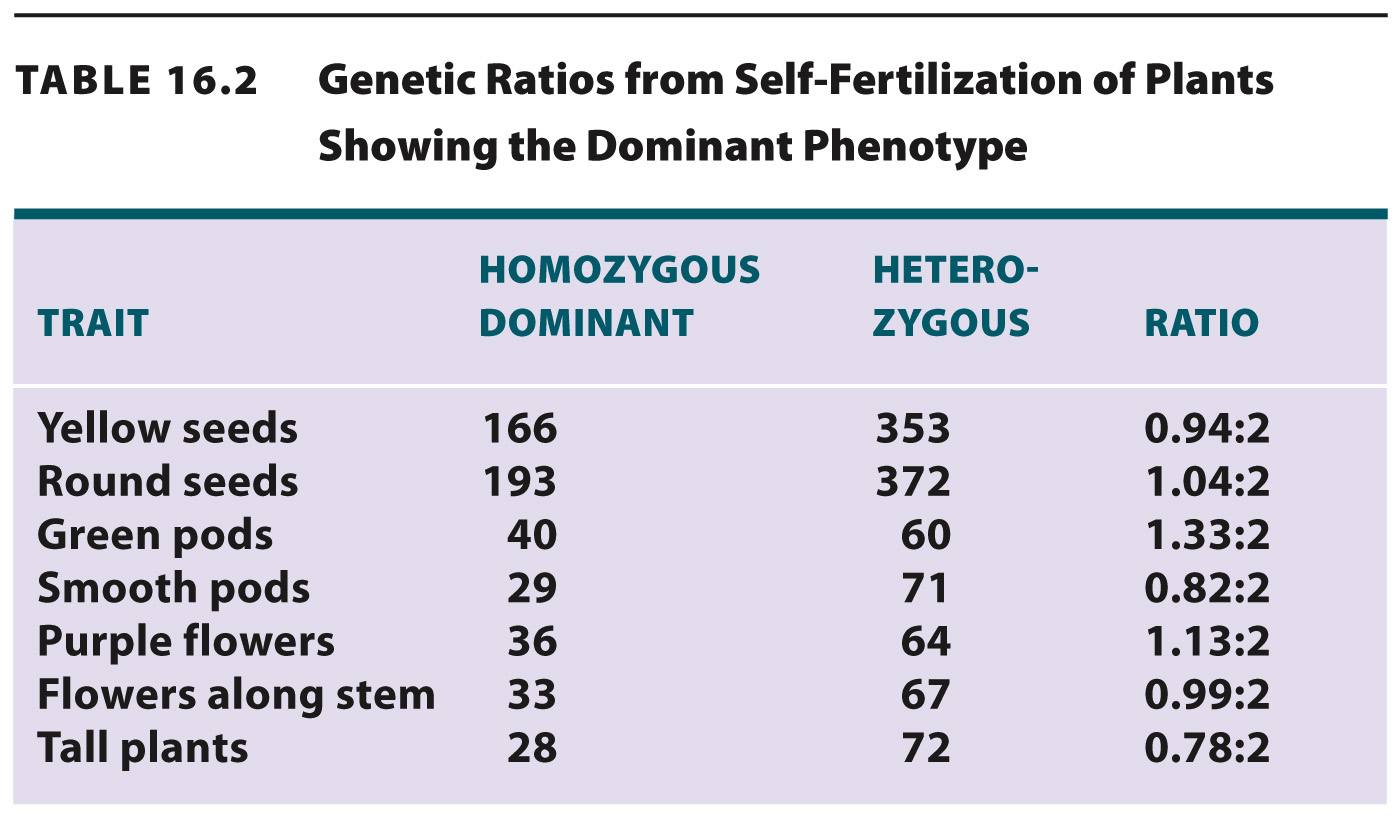
The second prediction from the Punnett square in Fig. 16.7 is more complex. It has to do with the seeds in the F2 generation that show the dominant yellow phenotype. Note that although these seeds have the same phenotype, they have two different genotypes (AA and Aa). Among just the yellow seeds, ⅓ should have the genotype AA and ⅔ should have the genotype Aa, for a ratio of 1 AA:2 Aa. (The proportions are ⅓:⅔ because we are considering only the seeds that are yellow.) Plants with the AA and Aa genotypes can be distinguished by the types of seed they produce when self-