For complex traits, offspring resemble parents but show regression toward the mean.
Galton’s observations are as important in understanding complex traits as Mendel’s are in understanding single-
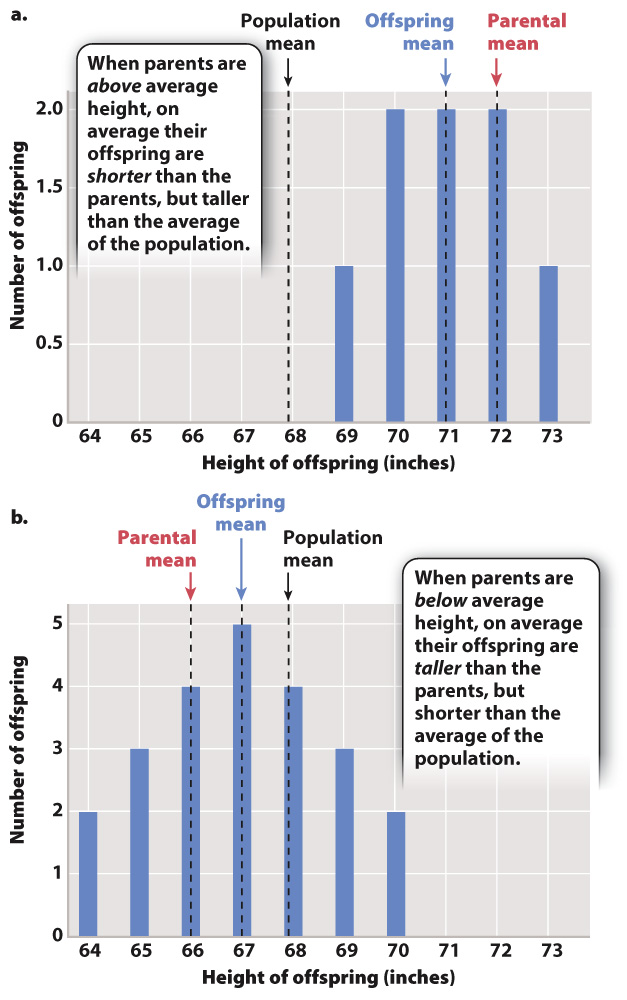
The bar graph in Fig. 18.7a shows the distribution of height among the progeny of the tallest parents, whose average height is 72 inches. The mean height of the offspring is 71 inches, which is greater than the mean height of the whole population of the study (68.25 inches) but less than that of the parents. The bar graph in Fig. 18.7b is the distribution of height of progeny of the shortest parents, who averaged 66 inches. In this case, the mean height of the progeny is 67 inches, which is less than the mean height of the population but greater than that of the parents. Note, however, that some of the offspring of tall parents are taller than their parents, and likewise some of the offspring of short parents are shorter than their parents. It is only on average that the height of the offspring is less extreme than that of the parents.
Galton’s results can be plotted on a graph, represented as the blue data points in Fig. 18.8, in which the average height of each pair of parents (called the midparent value) is compared with that of their child. For convenience in visualization, midparent heights are grouped into categories, and the mean of each group is plotted along the x-
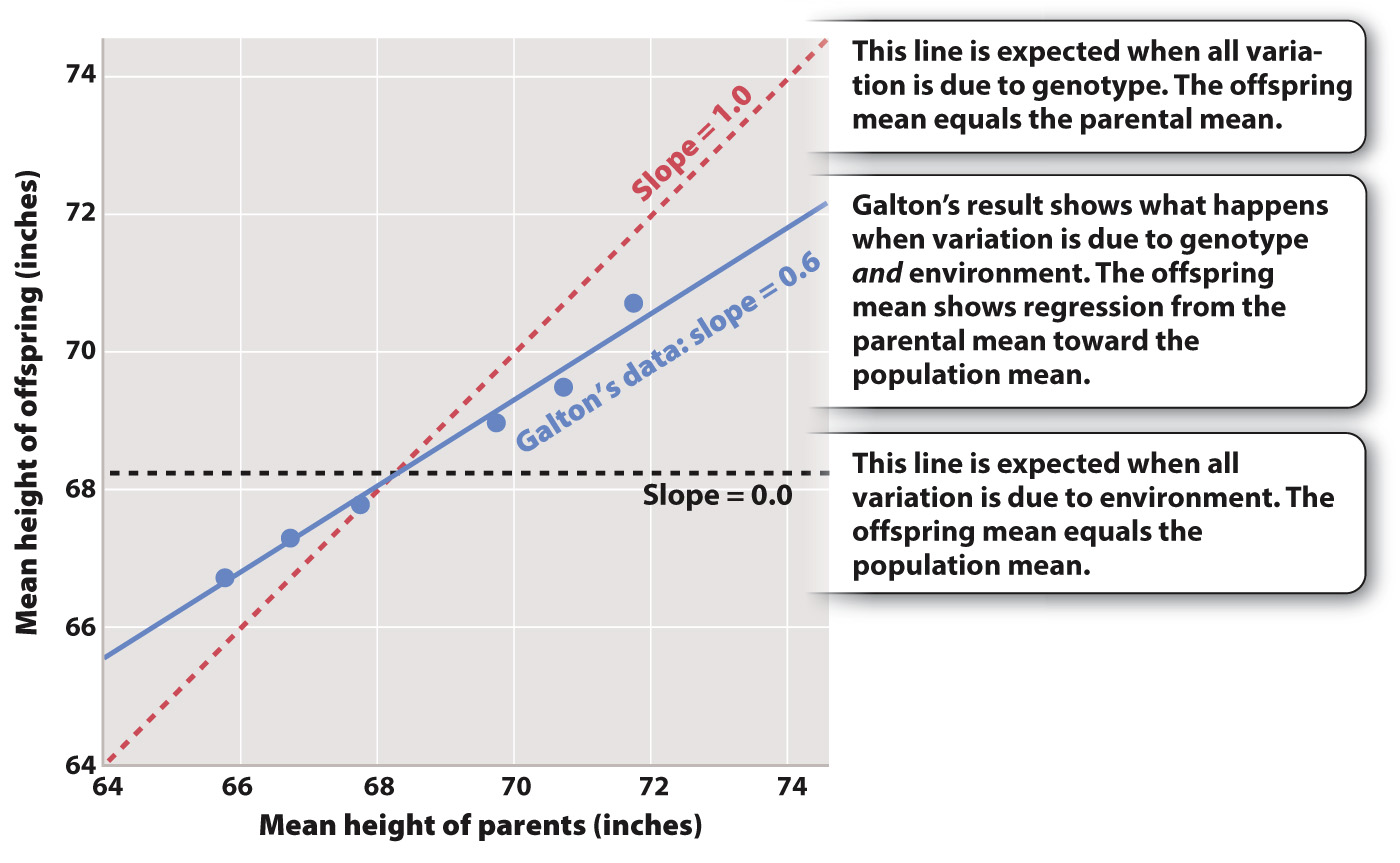
Galton regarded this observation as his most important discovery, publishing his results in 1886. Today, we call it regression toward the mean. The offspring exhibit an average phenotype that is closer to the population mean than the phenotype of the parents. In other words, when the average height of the parents is smaller than the population mean, then the average height of the offspring is greater than that of the parents (but smaller than the population mean). Likewise, when the average height of the parents is greater than the population mean, then the average height of the offspring is smaller than that of the parents (but greater than the population mean).
Regression toward the mean is observed for two reasons. The first is that during meiotic cell division (Chapter 11), segregation and recombination break up combinations of genes that result in extreme phenotypes, such as very tall or very short, that are present in the parents. The second reason is that the phenotype of the parents results not only from genes but also from the environment. Environmental effects are not inherited, so any effect of the environment on the parents’ phenotypes is not transmitted to the offspring. For example, if the parents are tall or short purely because of an environmental effect like better or worse nutrition, the average height of the offspring will be equal to the population mean.
Quick Check 1 Does regression toward the mean imply that the human population is getting shorter over time?
Quick Check 1 Answer
No. Regression toward the mean simply indicates that, in any population, parents with extreme phenotypes (very tall or very short, for example) will tend to have offspring that are closer to the average height of the population.