The Hardy–Weinberg equilibrium relates allele frequencies and genotype frequencies.
Now that we have established the conditions required for a population to be in Hardy–
The logic is simple. Random mating is the equivalent of putting all the population’s gametes into a single pot and drawing out pairs of them at random to form a zygote, which is the same principle we saw in action in the discussion of independent assortment in Chapter 16. We therefore put in our 70 A alleles and 30 G alleles and pick pairs at random. What is the probability of picking an AA homozygote (that is, what is the probability of picking an A allele followed by another A allele)? The probability of picking an A allele is its frequency in the population, so the probability of picking the first A is 0.7. What is the probability of picking the second A? Also 0.7. What then is the probability of picking an A followed by another A? It is the product of the two probabilities: 0.7 × 0.7 = 0.49. Thus, the frequency of an AA genotype is 0.49. We take the same approach to determine the genotype frequency for the GG genotype: Its frequency is 0.3 × 0.3, or 0.09.
What about the frequency of the heterozygote, AG? This is the probability of drawing G followed by A, or A followed by G. There are thus two separate ways in which we can generate the heterozygote. Its frequency is therefore (0.7 × 0.3) + (0.3 × 0.7) = 0.42.
As seen in the Punnett square on the left in Fig. 21.5, we can generalize these calculations algebraically by substituting letters for the numbers we have computed to derive the relation defined by the Hardy–
| Genotypes | AA | AG | GG |
| Frequencies | p2 | 2pq | q2 |
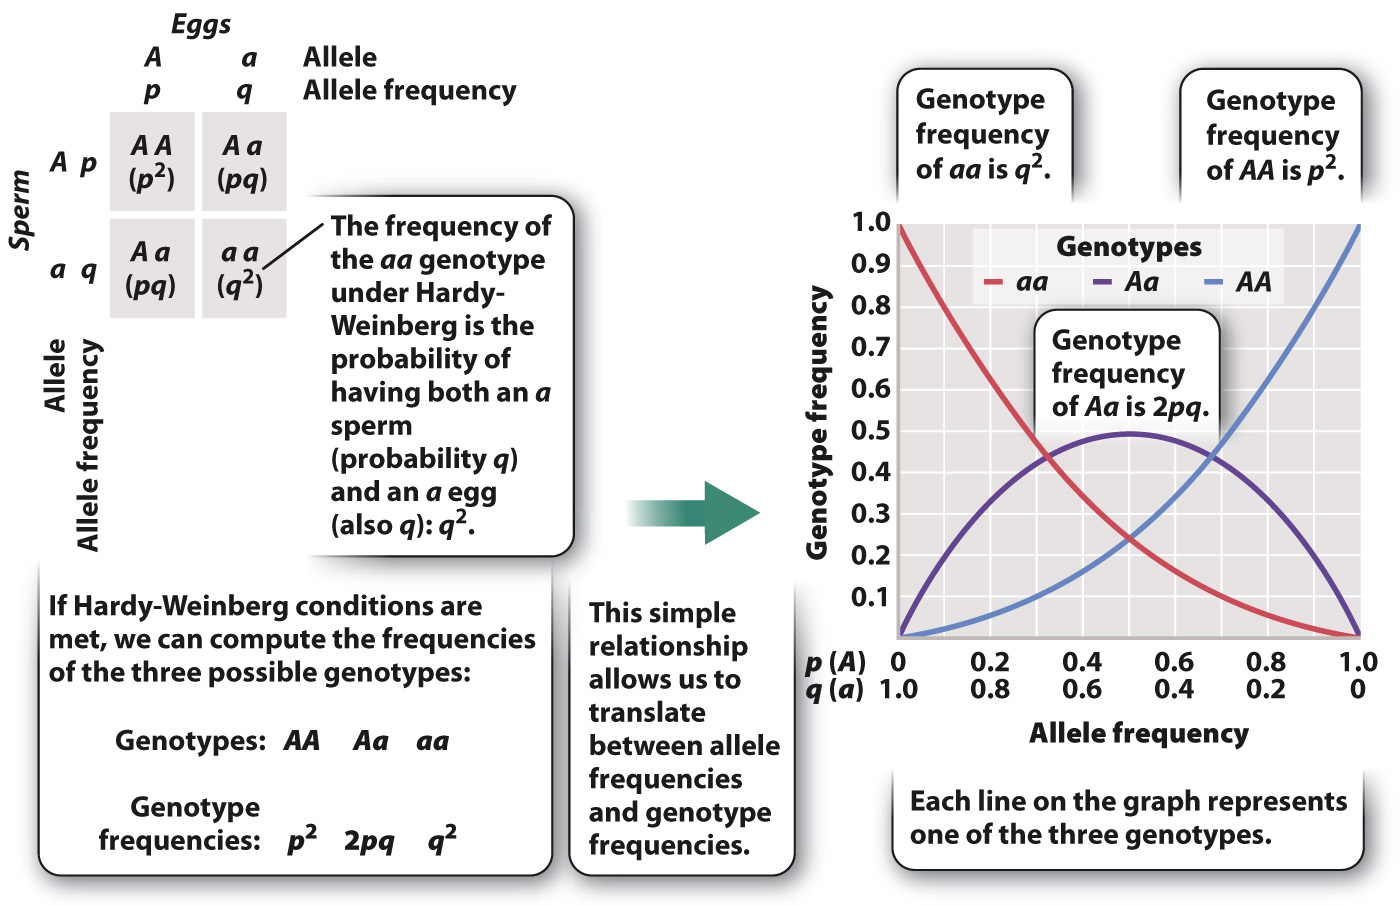
In the graph on the right hand side of Fig. 21.5, we have replaced the p’s and q’s with numbers. If no a alleles are present, then q = 0 and p = 1 and the frequency of AA is 1. In this case, all the genotypes in the population are AA and, accordingly, the blue line representing the frequency of AA in the population is at 1, and the red line representing the frequency of aa and the purple line representing the frequency of Aa are both at 0. When no A alleles are present, all individuals have genotype aa, and the red line is at 1 and the others at 0.
Not only does the Hardy–
The graph in Fig. 21.5 also shows how allele and genotype frequencies are related. We can use the graph to determine allele frequencies for given genotype frequencies and genotype frequencies for given allele frequencies. For example, if the population we are examining has a 0.5 frequency of heterozygotes, Aa, the purple line in the graph indicates that both p and q are 0.5. If we know that p = 0.5 (and therefore q = 0.5), we can look at the lines to infer that the frequency of heterozygotes is 0.5 and the frequency of both homozygotes, AA and aa, is the same, 0.25.
We can do this mathematically as well. Knowing the genotype frequency of AA, for example, permits us to calculate allele frequencies: if, as in our Adh example, p2 is 0.49 (that is, 49% of the population has genotype AA), then p, the allele frequency of A, is √0.49 = 0.7. Because p + q = 1, then q, the allele frequency of a, is 1 – 0.7 = 0.3.
Note that these relationships hold only if the Hardy–