Human activities play an important role in the modern carbon cycle.
Now let us ask about the second major pattern evident in the Keeling curve. Although CO2 levels oscillate on an annual basis, the overall pattern is one of sustained increase. During the 1960s, the observed increase was less than 1 ppm each year. In the first decade of the new millennium, it has been closer to 2 ppm. The current level of atmospheric CO2 is more than 25% higher than it was 50 years ago. Why has CO2 input into the atmosphere outstripped removal for the past half century? Should we consider this pattern unusual?
Answering the second question helps us to address the first. Conclusions about whether it is unusual for atmospheric CO2 to increase 25% in 50 years can be answered only if we can compare the Keeling curve with longer records of atmospheric CO2 levels. Before Keeling, no one systematically collected air samples. Fortunately, however, nature did it for us.
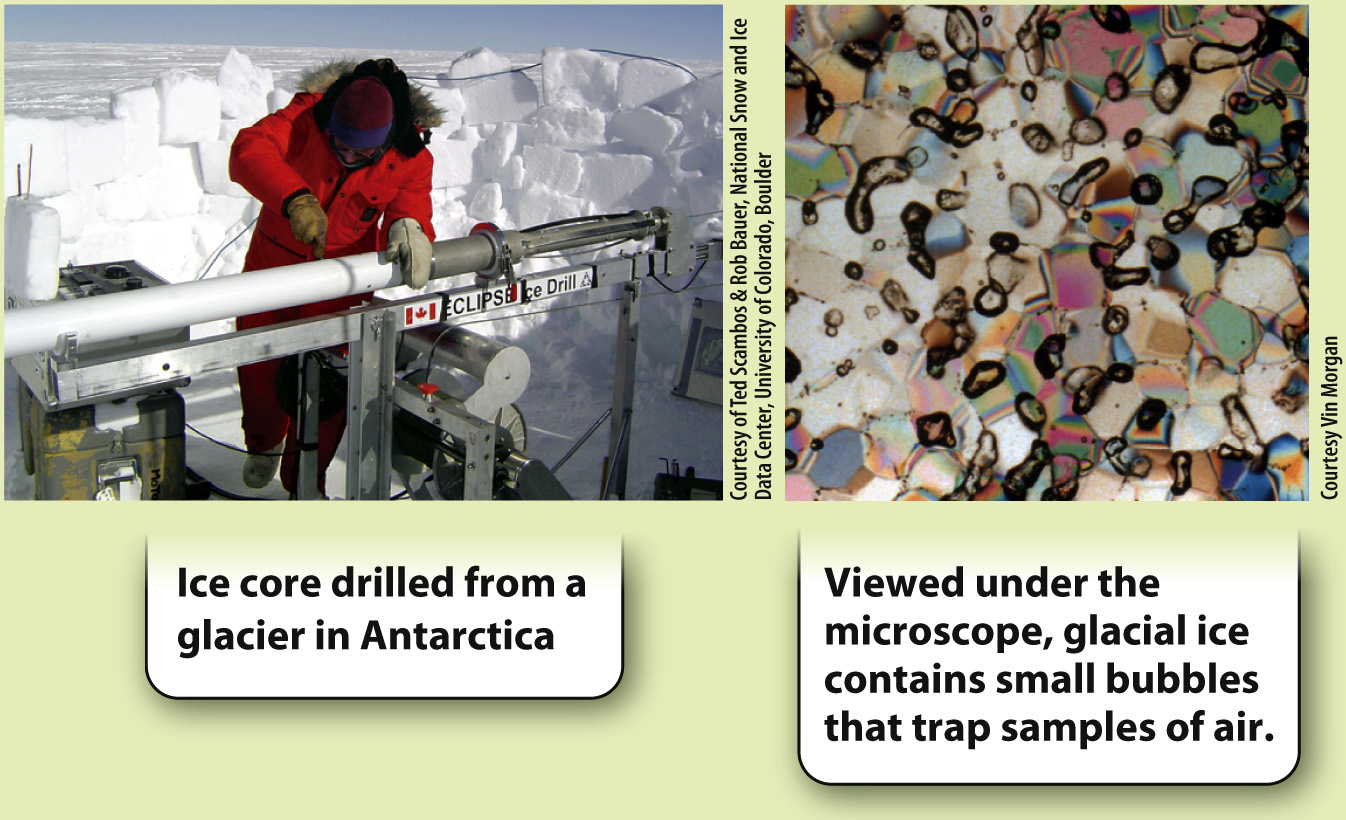
When glacial ice forms, it traps tiny bubbles of air. Each year, snowfall gives rise to a new layer of ice, and as layers accumulate through time their bubbles preserve a history of the atmosphere. The graph in Fig. 25.3 shows the amount of CO2 in air bubbles trapped in Antarctic ice that has accumulated over the past 1000 years. Ice samples show that CO2 levels actually began to increase slowly in the 1800s, the time of major transformations in mining, manufacturing, and transportation we call the Industrial Revolution. Before that, however, atmospheric CO2 levels had varied little since the Middle Ages, staying at 270–
HOW DO WE KNOW?
FIG. 25.3
How much CO2 was in the atmosphere 1000 years ago?
BACKGROUND Direct measurements of the atmosphere show that CO2 has increased by 25% over the past 50 years. To know whether or not such a change is unusual, we need to know CO2 levels over a longer time interval.
OBSERVATION Scientists recognized that the snow that accumulates on glaciers to form new layers of ice is initially full of small spaces that are in contact with the air. Through time, as snow changes to ice, these spaces become sealed off from the surrounding environment and form bubbles, preserving a minute sample of air at the time of ice formation.
MEASUREMENTS Identifying chemical indicators that vary on an annual basis in successive layers of ice enabled scientists to assign ages to ice samples taken from cores drilled through the Law Dome, a large ice dome in Antarctica. The youngest ice samples overlap in age with the first part of the Keeling data, providing a check that air samples trapped in ice have CO2 concentrations similar to those in air measured directly over the same interval.
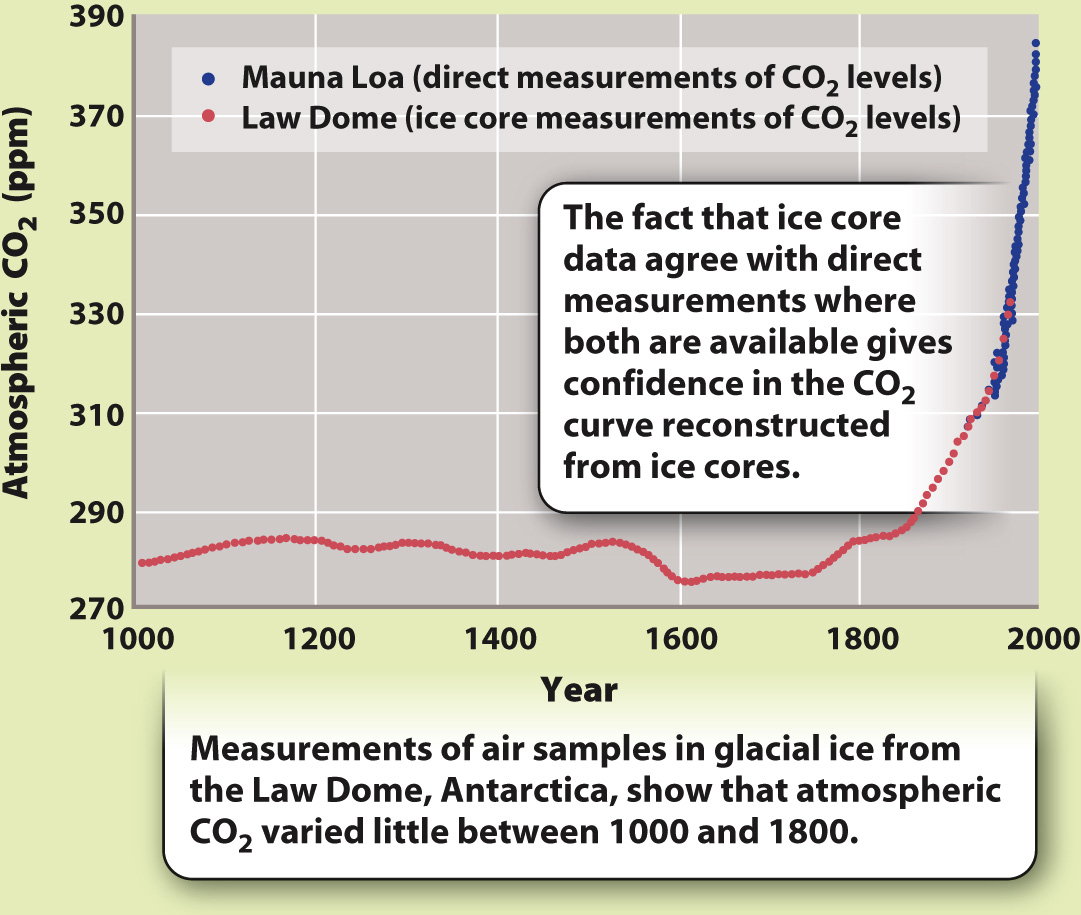
CONCLUSIONS Before the Industrial Revolution, atmospheric CO2 levels had varied little over 1000 years, generally falling between 270 and 280 ppm. From this, scientists have concluded that current changes in atmospheric CO2 are unusual on the timescale of the past millennium.
SOURCE Etheridge, D. M., et al. 1996. “Natural and Anthropogenic Changes in Atmospheric CO2 over the Last 1000 Years from Air in Antarctic Ice and Firn.” Journal of Geophysical Research 101:4115–
Fig. 25.3 shows that there is a correlation between the increasing CO2 content of the atmosphere and human activities. A correlation simply indicates that two events or processes occur together. Can we actually demonstrate that humans have played a role in recent atmospheric change? By itself, correlation does not establish causation, a relationship in which one event leads to another. We might propose instead that recent CO2 increase reflects natural processes and only matches the period of industrialization by coincidence.
Quick Check 1 How does the graph in Fig. 25.3 suggest that human activities have influenced CO2 levels in the atmosphere? What might be a plausible alternative hypothesis?
Quick Check 1 Answer
The coincidence in timing between the Industrial Revolution and the observed increase in CO2 levels—