Hemoglobin reversibly binds oxygen.
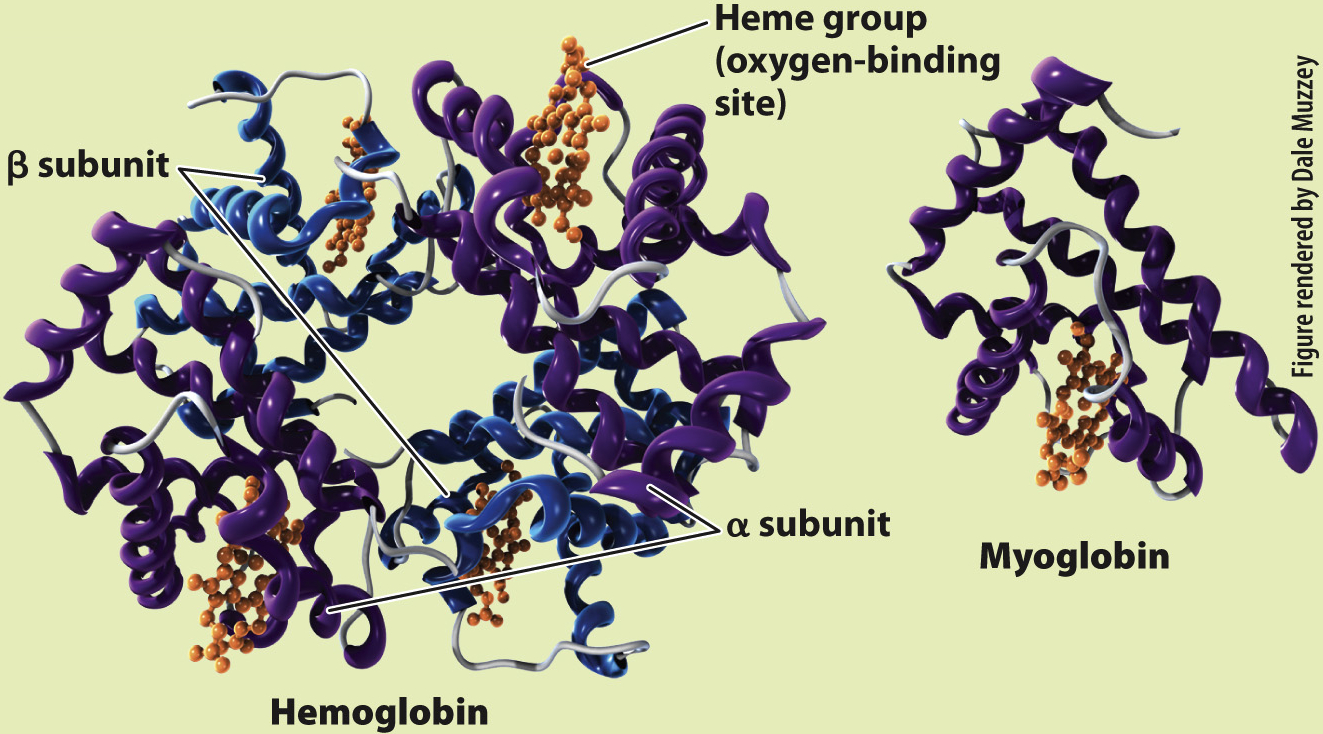
Hemoglobin exists in large concentrations within red blood cells. It is a globular protein that consists of four polypeptide units (Fig. 39.12). Each of these four units surrounds a heme group that contains iron, which reversibly binds one O2 molecule. After O2 diffuses into the blood, it diffuses into the red blood cells and binds to the heme groups in hemoglobin. Hemoglobin’s binding of O2 removes O2 from solution, keeping the pO2 of the red blood cell below that of the blood plasma, so O2 continues to diffuse into the cell. The removal of O2 from the plasma, in turn, keeps the pO2 of the plasma below that of the lung alveolus, so O2 continues to diffuse from the lungs into the blood.
HOW DO WE KNOW?
FIG. 39.12
What is the molecular structure of hemoglobin and myoglobin?
BACKGROUND In the 1950s, the Austrian Max Perutz worked with John Kendrew in the Cavendish Laboratory of the University of Cambridge to determine the molecular structure of globular proteins. Perutz and Kendrew were interested in understanding how the structures of hemoglobin and myoglobin enabled binding and transport of O2.
EXPERIMENT Perutz and Kendrew developed and applied the new technique of X-
RESULTS Perutz and Kendrew showed that adult hemoglobin consists of four subunits, two α (alpha) and two β (beta) subunits. Each subunit contains a heme group that contains iron, which is the site of O2 binding. By contrast, myoglobin consists of only a single subunit with one heme group. These differences in molecular structure underlie the O2-binding and dissociation properties of the two O2 transport proteins.
FOLLOW-
SOURCES Kendrew J. C., and M. F. Perutz. 1948. “A Comparative X-
When more O2 is present in blood plasma, we expect more O2 to become bound to hemoglobin, and that is what happens. But there is an interesting wrinkle that enables hemoglobin to readily bind O2 leaving the lung. If we plot blood pO2 against the percentage of O2 bound to hemoglobin (the relation defined as “hemoglobin saturation”), we get the curve shown in Fig. 39.13a. As blood pO2 increases, hemoglobin saturation rises slowly at first, then more steeply, and then more slowly again until it levels out. At 100% saturation, all hemoglobin molecules bind four O2 molecules. The curve is called the hemoglobin’s oxygen dissociation curve, and it has a sigmoidal shape—
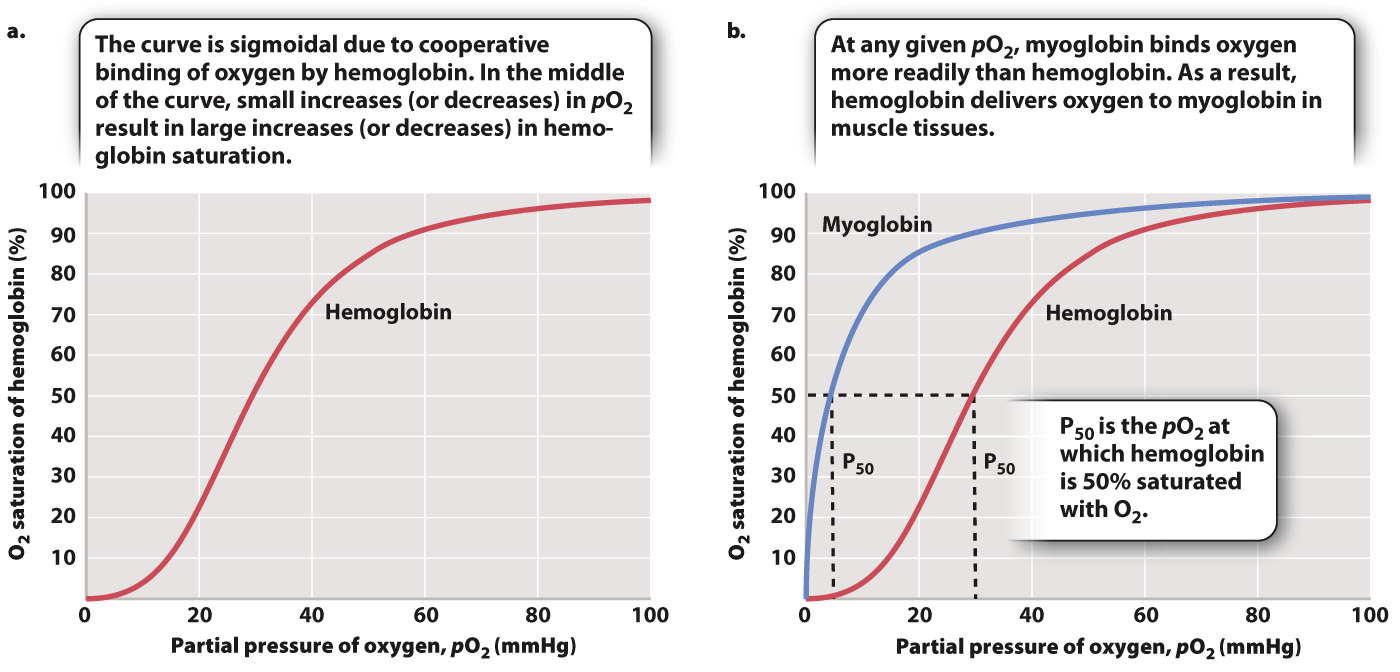
The shape of this curve can be explained as a result of changes in the ability of hemoglobin to bind O2 (a property called its binding affinity) at different O2 partial pressures. At 25% saturation, each hemoglobin molecule binds on average one O2 molecule. As pO2 rises, hemoglobin binds O2 with increasing binding affinity as a result of the interaction of adjacent heme groups. After one heme group binds the first O2 molecule, hemoglobin undergoes a conformational change that increases the binding affinity of the remaining heme groups for additional O2. The increase in binding affinity with additional binding of O2 is called cooperative binding, and it gives the O2 dissociation curve for hemoglobin its sigmoidal shape.
Cooperative binding has important physiological consequences. In the middle part of the O2 dissociation curve, small increases in O2 concentration lead to large increases in hemoglobin saturation. Therefore, in normal circumstances, hemoglobin in the blood leaving the lung is fully saturated with O2—each hemoglobin molecule is bound to four O2 molecules.
The shape of the O2 dissociation curve also helps to explain how O2 is delivered to respiring cells. When the hemoglobin in red blood cells reaches tissues needing O2 to supply their mitochondria, the O2 is released from the hemoglobin. As active cells consume O2, they reduce the local pO2 of the cell and surrounding tissues to 40 mmHg or less. At these lower pO2 values, the hemoglobin’s O2 dissociation curve has a steep slope (Fig. 39.13a). The steepness of the slope indicates that for a relatively small decrease in pO2, large amounts of O2 can be released from hemoglobin to diffuse into the cell.