Logistic growth produces an S-shaped curve and describes the growth of many natural populations.
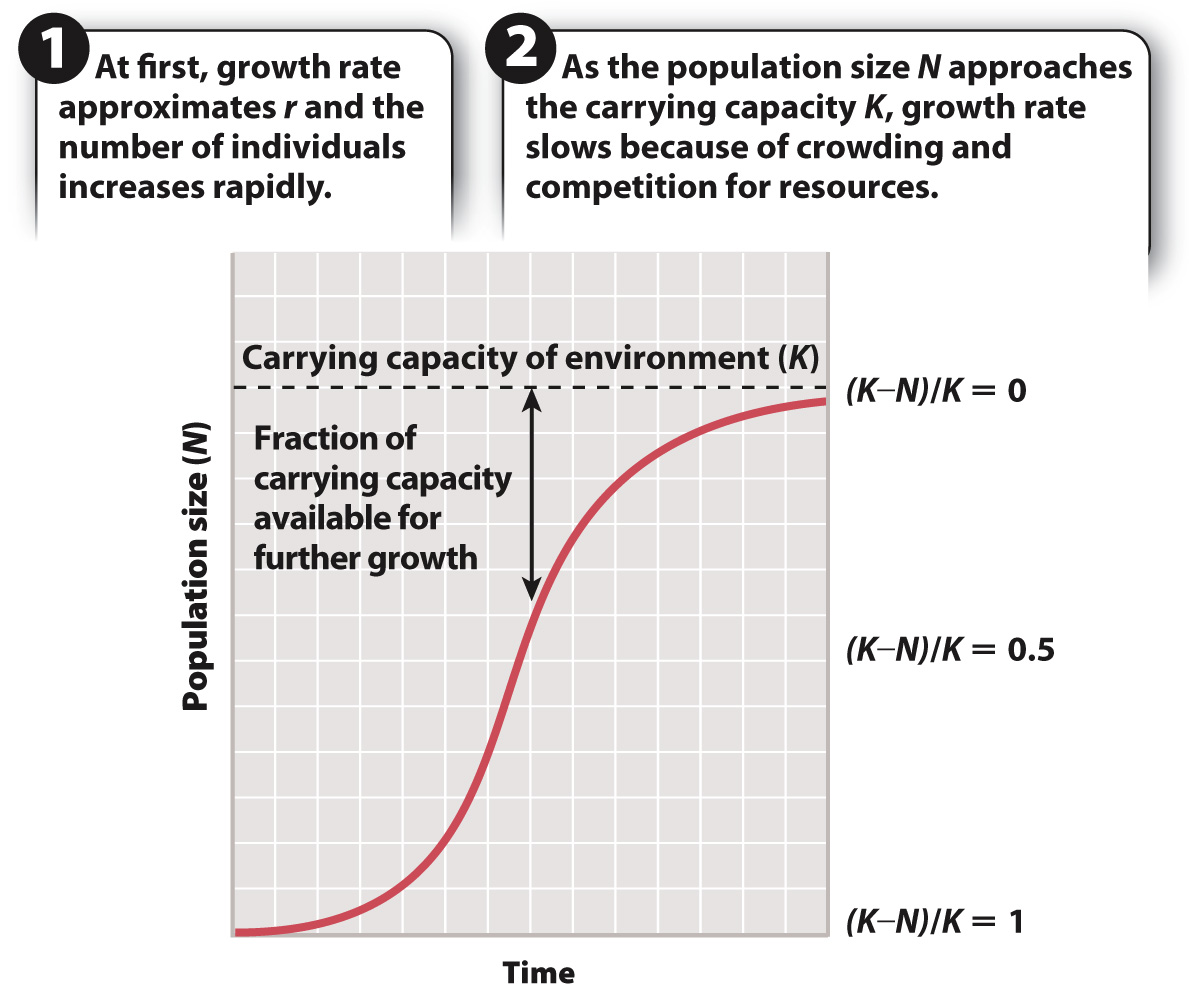
When a population is small, resources are not limiting and the population can grow at or near its intrinsic growth rate, r. As the population increases, however, drawing closer to K, the worsening conditions due to crowding slow the rate of growth. For any given population at any given moment, such as deer today in New England forests or striped bass in Chesapeake Bay, we may wish to know what fraction of the carrying capacity is available for further population growth. The answer, expressed mathematically, is (K – N)/K.
The effects on population growth as a habitat fills up with individuals can be seen in Fig. 46.6. Growth is exponential at first and then slows as the population size approaches its maximum sustainable size, K. The resulting pattern of population growth, with its characteristic S-
N2 = N1 + rN1 [(K – N1)/ K]
Logistic growth curves are S-
Many natural populations grow this way. Logistic curves also apply to many other phenomena in biology, as well as in such diverse fields as chemistry, sociology, political science, and economics. For example, a logistic curve describes the rate that oxygen binds to a population of hemoglobin molecules, as seen in Chapter 39. Similarly, the number of fertilized salmon eggs goes up with the amount of sperm (which reflects the number of males in the population) deposited in a stream by males but slows again as the percentage of unfertilized eggs available for the sperm to fertilize drops.
Quick Check 3 Why is the growth curve for most populations S-
Quick Check 3 Answer
Logistic curves are S-